
Slovenia September 2025: Skoda places three models in Top 4
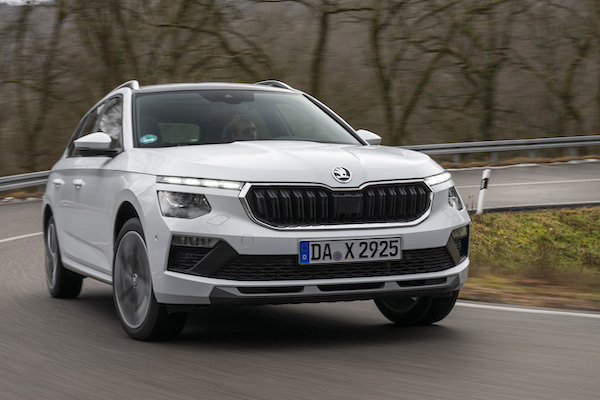
Skoda Kamiq sales are up 50% year-on-year in September.
4,903 new cars hit Slovenian roads in September, a sturdy +9.9% year-on-year improvement. The year-to-date volume stands at 44,418, up 8.3% over the same period last year. Volkswagen (+8.5%) maintains its lead in the brands charts with 15.4% share, distancing Skoda (+12.3%) at 11.1%. Renault (-20.1%) sinks but still manages to round out the podium. Both Hyundai (+45.2%) and Kia (+45.1%) stun and rank #4 and #6 respectively. Tesla (+54.7%) posts the largest year-on-year gain in the Top 10 at #10. Below, Forthing (+610%), Cupra (+135.7%) and Mercedes (+93.8%) stand out while Leapmotor breaks into the Top 20 for its third month in market.
The Renault Clio (-34.2%) remains the most popular nameplate in the country but freefalls year-on-year. It is followed by three Skodas: the Octavia (+20%), Kodiaq (-10.9%) and Kamiq (+50%). The Tesla Model Y (+227.3%) surges to #5, its best result since August 2023. The VW T-Roc (+148.8%) continues to be boosted by rebates on the outgoing generation at #6 and ascends to #9 year-to-date. The Peugeot 2008 (+23.8%), Dacia Duster (+19%) and VW Tiguan (+14.1%) all shine below.
Previous month: Slovenia August 2025: Renault Clio and VW T-Roc dominate, sales up 16.2%
One year ago: Slovenia September 2024: Renault Clio distant leader
Full September 2025 Top 50 All brands and Top 259 All models below.
Slovenia September 2025 – brands:
PosBrandSep-25%/24Aug2025%/24PosFY241Volkswagen75415.4%+ 8.5%16,75415.2%+ 11.3%112Skoda54611.1%+ 12.3%34,95411.2%+ 19.5%233Renault4539.2%– 20.1%24,64410.5%– 0.9%324Hyundai2895.9%+ 45.2%52,5865.8%+ 21.4%465Toyota2815.7%+ 6.4%42,4935.6%– 5.1%546Kia2094.3%+ 45.1%71,9364.4%+ 6.3%887Dacia1984.0%– 10.8%131,4693.3%– 10.5%1178Ford1913.9%+ 23.2%82,0524.6%+ 73.0%7119Peugeot1903.9%– 23.1%62,1194.8%– 7.5%6510Tesla1643.3%+ 54.7%187261.6%+ 6.9%161811Opel1613.3%+ 43.8%91,2402.8%+ 3.5%121312Mercedes1573.2%+ 93.8%161,1832.7%+ 32.0%141513Audi1523.1%– 7.3%111,5063.4%– 1.3%10914Citroen1473.0%+ 20.5%101,5723.5%+ 0.0%91015BMW1002.0%– 10.7%141,1872.7%– 3.6%131216MG811.7%– 23.6%175461.2%– 4.9%212117Forthing711.4%+ 610.0%156431.4%+ 536.6%183018Cupra661.3%+ 135.7%205811.3%+ 63.2%202219Suzuki591.2%– 9.2%226931.6%– 24.4%171620Leapmotor591.2%new241180.3%new34 –21Mazda561.1%– 25.3%195971.3%+ 1.4%192022Nissan551.1%– 11.3%128131.8%+ 23.9%151723Fiat531.1%– 58.6%293190.7%– 67.0%251424Jeep521.1%+ 26.8%233580.8%+ 18.9%232525Seat471.0%– 28.8%214871.1%– 34.8%221926Geely450.9%+ 36.4%263350.8%+ 18.8%242327KG Mobility/Ssangyong330.7%+ 135.7%272700.6%+ 107.7%272928Volvo300.6%+ 36.4%252810.6%– 3.4%262429Dongfeng220.4%+ 1000.0%282220.5%#######283730Porsche180.4%– 5.3%302030.5%– 1.0%292631Honda150.3%– 21.1%321380.3%– 27.4%302732Alfa Romeo150.3%+ 275.0%331320.3%+ 53.5%323233Mitsubishi150.3%– 42.3%341220.3%– 36.5%332834Lexus120.2%– 40.0%371330.3%+ 33.0%313135Lynk & Co120.2%+ 300.0%31600.1%+ 445.5%383836DFSK110.2%newn/a120.0%new42 –37Land Rover100.2%– 9.1%35880.2%+ 17.3%353338Mini90.2%+ 50.0%36790.2%+ 38.6%363439Hongqi60.1%new43110.0%new43 –40BAIC60.1%new –80.0%new45 –41DS50.1%– 54.5%42440.1%– 39.7%393542BYD50.1%n/a4680.0%+ 700.0%464943Subaru40.1%+ 300.0%39750.2%+ 212.5%373644Jaecoo40.1%new38110.0%new44 –45Man30.1%n/a –430.1%+ 616.7%403946Omoda30.1%new4170.0%new48 –47Ferrari20.0%+ 100.0%4480.0%+ 100.0%474148Alpine10.0%n/a40130.0%+ 333.3%414249Morgan10.0%new –10.0%new58 – –Others250.5%+ 108.3% –5011.1%+ 38.4% – –
Slovenia September 2025 – models:
PosModelSep-25%/24Aug2025%/23PosFY241Renault Clio1964.0%– 34.2%11,9784.5%+ 11.4%112Skoda Octavia1743.5%+ 20.0%31,5673.5%+ 19.2%223Skoda Kodiaq1142.3%– 10.9%111,0012.3%+ 3.5%544Skoda Kamiq1082.2%+ 50.0%61,1122.5%+ 43.3%475Tesla Model Y1082.2%+ 227.3%374531.0%+ 43.8%23416VW T-Roc1072.2%+ 148.8%28451.9%+ 20.9%9147VW Tiguan1052.1%+ 14.1%108862.0%+ 4.5%698Renault Captur1022.1%– 25.5%121,4093.2%+ 10.9%339Dacia Duster1002.0%+ 19.0%167631.7%– 17.6%12610Peugeot 2008992.0%+ 23.8%48581.9%– 12.0%8511Hyundai Tucson962.0%+ 41.2%98782.0%+ 26.5%71012Opel Mokka851.7%+ 286.4%293410.8%+ 21.4%354613VW T-Cross741.5%– 21.3%77581.7%– 5.5%13814Forthing T5 Evo681.4%+ 580.0%85701.3%+ 526.4%178515Hyundai Kona681.4%+ 195.7%304241.0%+ 44.7%264516Toyota Corolla621.3%– 22.5%135641.3%– 14.7%181617VW Taigo611.2%– 20.8%205371.2%– 20.1%201518Kia Sportage581.2%+ 28.9%155551.2%– 1.6%192019Dacia Sandero561.1%– 43.4%493640.8%– 24.9%321720Kia Stonic561.1%+ 211.1%214491.0%+ 17.2%243121Tesla Model 3561.1%– 18.8%432730.6%– 22.2%423422VW Golf541.1%– 45.5%318191.8%+ 34.9%101123VW Caddy521.1%+ 300.0%672150.5%+ 55.8%607424Citroen C3511.0%+ 21.4%187881.8%+ 18.5%111925Toyota Yaris Cross511.0%– 13.6%146111.4%– 25.8%151226Kia Ceed460.9%+ 31.4%274461.0%+ 38.9%253327Leapmotor T03460.9%new38880.2%new115 –28Skoda Elroq460.9%new572060.5%new63 –29VW Passat460.9%+ 15.0%514221.0%+ 13.1%283130Ford Tourneo Custom450.9%+ 136.8%235201.2%+ 497.7%218831Mercedes B-Class450.9%+ 462.5%832060.5%+ 160.8%6211430Toyota RAV4440.9%+ 91.3%472470.6%+ 7.4%495231Jeep Avenger430.9%+ 26.5%282880.6%+ 31.5%405432Renault Austral430.9%– 10.4%304160.9%– 4.1%292233Ford Kuga420.9%+ 61.5%324221.0%+ 1.2%272534Toyota Yaris410.8%– 4.7%632310.5%– 39.7%552835Toyota C-HR400.8%+ 8.1%223620.8%+ 29.3%334036Skoda Karoq390.8%– 20.4%313850.9%– 4.7%302637Mazda CX-30370.8%– 22.9%363830.9%+ 37.8%314338VW Polo360.7%– 30.8%1152820.6%– 33.6%412739VW Tayron360.7%new442550.6%new45 –40Audi Q3350.7%+ 9.4%253720.8%– 8.6%312941Kia Xceed340.7%+ 17.2%422440.5%– 1.6%505142Mercedes GLC340.7%+ 277.8%732510.6%+ 126.1%468443VW ID.7340.7%+ 385.7%881640.4%+ 51.9%789144Audi Q5330.7%+ 26.9%681940.4%+ 19.8%677045Opel Frontera330.7%new241760.4%new74 –46Peugeot 208330.7%– 71.1%196501.5%– 8.7%141347Renault Symbioz320.7%+ 300.0%501920.4%+ 2033.3%6816048Nissan Qashqai310.6%– 36.7%56101.4%+ 27.3%161849VW Multivan310.6%– 24.4%605111.2%+ 13.6%222350Ford Puma300.6%+ 66.7%801870.4%– 3.6%696251Ford Tourneo Connect300.6%+ 500.0%35930.2%+ 97.9%11113252Renault 5300.6%+ 2900.0%261870.4%+ 18600.0%7034353VW ID.3300.6%– 31.8%1841040.2%+ 3.0%1048954VW ID.4300.6%+ 150.0%762670.6%+ 233.8%4311155VW Touran290.6%– 51.7%453620.8%+ 21.1%343056Citroen C3 Aircross280.6%– 15.2%461520.3%– 58.7%823857Citroen C5 Aircross280.6%+ 460.0%691610.4%+ 15.8%798358Cupra Born270.6%+ 17.4%652480.6%+ 27.8%475060Fiat 600270.6%+ 575.0%1041390.3%+ 3375.0%8721561Hyundai Bayon270.6%– 22.9%532360.5%– 32.6%533962Peugeot 3008270.6%+ 42.1%962340.5%+ 73.3%547563Opel Corsa260.5%– 16.1%173370.8%– 7.2%363564Suzuki SX4 S-Cross260.5%+ 62.5%872390.5%– 11.5%524865Toyota Proace260.5%+ 136.4%582640.6%+ 60.0%446466Fiat Grande Panda250.5%new97430.1%new163 –67Geely Cityray250.5%new –420.0%new168 –68MG ZS EV250.5%– 63.8%842160.5%– 40.0%583769MG ZS240.5%new34750.2%new125 –70Suzuki Vitara240.5%– 17.2%543370.8%– 20.0%373071Dacia Bigster230.5%new481530.3%new81 –73Skoda Fabia230.5%– 34.3%862410.5%+ 8.6%515574Dongfeng Box220.4%+ 2100.0%522170.5%+ 21600.0%5720375Seat Leon220.4%+ 57.1%392480.6%+ 17.5%485876Hyundai i10210.4%+ 162.5%412990.7%+ 95.4%387377BMW X3200.4%+ 233.3%1161240.3%+ 20.4%9210478Citroen C4200.4%+ 122.2%621980.4%– 4.8%646579Dacia Jogger190.4%– 51.3%561580.4%– 15.5%805380Hyundai i20190.4%+ 72.7%332960.7%– 13.2%394481Hyundai Ioniq 5180.4%+ 200.0%98960.2%+ 100.0%10913882Mercedes GLA180.4%+ 20.0%1171230.3%+ 36.7%9310383Seat Arona180.4%– 37.9%911090.2%– 40.1%987184Skoda Enyaq180.4%+ 157.1%113760.2%+ 31.0%12413185Audi A5170.3%+ 183.3%1241410.3%+ 327.3%8615586Mercedes V-Class170.3%+ 183.3%1181060.2%+ 7.1%10110087Renault Scenic170.3%+ 1600.0%181430.1%+ 10.3%16716688Citroen Berlingo160.3%– 46.7%612060.5%+ 60.9%616989Ford Explorer160.3%+ 300.0%94580.1%+ 728.6%14322090Hyundai i30160.3%– 44.8%811950.4%– 4.4%665791Volvo XC40160.3%+ 300.0%1321010.2%– 16.5%1078192KG Mobility Korando150.3%+ 87.5%901100.2%– 3.5%979693Skoda Scala150.3%– 31.8%661960.4%– 0.5%656394Cupra Tavascan140.3%new791170.3%new9518095Cupra Terramar140.3%new1471250.3%new9124496Audi Q2130.3%– 64.9%701440.3%– 59.1%853697Audi Q4130.3%+ 85.7%144660.1%– 4.3%13412598Leapmotor C10130.3%new128300.1%new191 –99MG 4130.3%– 18.8%129880.2%– 7.4%11690100MG HS130.3%+ 0.0%178830.2%– 22.4%12087101Renault Trafic130.3%– 18.8%851330.3%– 77.1%8821102Alfa Romeo Junior120.2%new108960.2%new108 –103Peugeot 308120.2%– 29.4%1311820.4%– 40.9%7342104Cupra Formentor110.2%+ 120.0%78730.2%– 40.7%12786105DFSK Seres 3110.2%new –120.0%new240 –106Geely Starray110.2%new951080.2%new100181107Lynk & Co 02110.2%new82430.1%new164 –108Nissan X-Trail 110.2%+ 266.7%152910.2%+ 31.9%113119109Audi A3100.2%– 44.4%771750.4%+ 29.6%7576110Audi Q8100.2%+ 150.0% –710.2%+ 0.0%128118111BMW 2 Series100.2%+ 42.9%1021020.2%– 8.9%10592112KG Mobility Torres100.2%+ 400.0%149940.2%+ 944.4%110173113Kia EV3100.2%new1051130.3%new96339114Mercedes A-Class100.2%+ 66.7%1061020.2%+ 126.7%106133115Renault 4100.2%new –100.0%new251 –116Hyundai Inster90.2%new192890.2%new114 –117Hyundai Santa Fe90.2%– 43.8%174420.1%+ 68.0%169172118Mitsubishi ASX90.2%+ 50.0%120530.1%+ 12.8%149144119Skoda Superb90.2%– 67.9%751700.4%– 17.9%7760120Suzuki Swift90.2%– 18.2%1141090.2%+ 13.5%9993121Volvo XC6090.2%+ 28.6%100710.2%– 10.1%130110122Ford Tourneo Courier80.2%– 78.4%403770.8%+ 75.3%3049123Ford Transit Custom80.2%– 78.9%892290.5%+ 281.7%56108124Geely Coolray80.2%– 69.2%741730.4%+ 8.1%7667125Jeep Compass80.2%+ 100.0%154350.1%– 32.7%180142126Lexus LE80.2%– 33.3%1391040.2%+ 96.2%103121127Opel Astra80.2%– 61.9%1401060.2%– 49.5%10266128VW Caravelle80.2%n/a101420.1%n/a170 –129Audi A670.1%+ 40.0%92860.2%+ 79.2%117147130BMW 5 Series70.1%+ 75.0%1361290.3%+ 34.4%89102131BMW i570.1%+ 75.0%167330.1%+ 3.1%185171132BMW X170.1%– 63.2%711860.4%+ 38.8%7177133BMW X570.1%– 36.4%137640.1%– 33.3%137106134Mercedes CLA70.1%+ 75.0%156930.2%– 4.1%112105135Mini Cooper70.1%+ 133.3%119440.1%+ 25.7%160150136Nissan Townstar70.1%+ 40.0%179350.1%– 14.6%183151137Porsche Cayenne70.1%+ 40.0%142590.1%– 26.3%141116138Range Rover70.1%+ 75.0%122440.1%– 6.4%162153139Honda Civic60.1%+ 200.0%173330.1%– 21.4%187148140KG Mobility Tivoli60.1%+ 50.0%109510.1%+ 1175.0%152225141Mercedes E-Class60.1%+ 0.0% –410.1%– 19.6%171134142Peugeot Expert60.1%n/a121250.1%+ 733.3%200263143VW Touareg60.1%+ 20.0%209800.2%– 16.7%122107144VW Transporter60.1%– 45.5%551230.3%– 52.5%9456145BMW 1 Series50.1%+ 66.7%135800.2%+ 175.9%121174146BMW X450.1%– 37.5%146380.1%– 59.1%176109147BMW X650.1%+ 0.0%126440.1%– 15.4%159143148DS 750.1%– 37.5%172400.1%– 14.9%173146149Ford Capri50.1%new225190.0%new210 –150Ford Focus50.1%+ 25.0% –1280.3%+ 6.7%9082151Mazda CX-6050.1%+ 25.0%150350.1%+ 0.0%182152152Mazda350.1%+ 25.0%110640.1%+ 6.7%138124153Nissan Juke50.1%+ 0.0%111740.2%+ 32.1%126127154Opel Grandland X50.1%+ 150.0%991460.3%+ 386.7%84164155Peugeot 500850.1%– 37.5%141860.2%+ 352.6%118149156Peugeot Rifter50.1%– 28.6%160440.1%+ 10.0%161141157Porsche 91150.1%+ 66.7%112680.2%+ 58.1%132156158Porsche Cayman50.1%n/a –70.0%– 12.5%263255159Renault Megane Conquest50.1%– 77.3%1621520.4%– 16.0%8368160Toyota bZ4X50.1%+ 150.0%107860.2%+ 405.9%119196161Toyota Land Cruiser50.1%n/a143680.2%+ 1600.0%133176162VW California50.1%n/a241460.1%+ 253.8%158221163BMW M340.1%+ 300.0% –250.1%– 37.5%197157164BMW XM40.1%+ 300.0%171200.0%+ 100.0%208224165BYD Seal40.1%n/a –60.0%+ 500.0%266336166Honda CR-V40.1%n/a138490.1%– 3.9%153135167Hyundai Ioniq 640.1%+ 33.3%193220.0%+ 0.0%203183168Jaecoo 740.1%new127110.0%new244 –169Mazda6e40.1%new22950.0%new276 –170Mercedes AMG/GT40.1%+ 300.0% –520.1%+ 26.8%151159171Mitsubishi Outlander40.1%n/a158220.0%n/a205 –172Seat Ateca40.1%– 60.0%208590.1%– 58.2%14280173Toyota Highlander40.1%+ 0.0% –230.0%+ 4.5%202186174Audi Q6 e-tron30.1%new64790.2%new123269175Audi Q730.1%+ 0.0%165560.1%+ 250.0%144182176Audi RS330.1%+ 200.0%212180.0%+ 350.0%214272177BAIC X5530.1%new –40.0%new277 –178BAIC X730.1%new –40.0%new278 –179BMW 3 Series30.1%– 25.0%214310.1%– 53.7%189122180BMW i430.1%– 66.7%125520.1%– 36.6%150115181Citroen Jumpy30.1%n/a93540.1%+ 5300.0%148317182Honda HR-V30.1%– 40.0%153370.1%+ 32.1%178165183Hongqi HS330.1%new19160.0%new268 –184Hongqi HS530.1%new22750.0%new273 –185Man TGE30.1%n/a –430.1%+ 616.7%165233186Mazda230.1%– 82.4%176460.1%– 67.4%15779187Mercedes C-Class30.1%+ 50.0% –400.1%– 24.5%174139188Mercedes GLB30.1%– 40.0%231430.1%– 35.8%166126189Mercedes GLE30.1%– 40.0%199250.1%– 35.9%199161190MG 330.1%new177660.1%new135207191MG S5 EV30.1%new23340.0%new287 –192Omoda 530.1%new15970.0%new262 –193Peugeot 40830.1%+ 50.0%204380.1%– 60.0%177113194Renault Espace30.1%– 66.7%206330.1%– 37.7%188145195Seat Ibiza30.1%– 40.0%163690.2%– 27.4%131112196Subaru Forester30.1%n/a183480.1%+ 700.0%154247197Toyota Aygo X30.1%+ 50.0% –340.1%+ 78.9%184189198Volvo XC9030.1%– 57.1%133560.1%+ 19.1%145140199Alfa Romeo Giulia20.0%n/a21080.0%+ 100.0%255260200Audi A120.0%+ 100.0% –250.1%– 26.5%196167201BMW IX20.0%– 50.0%168300.1%+ 114.3%190216202BMW iX120.0%– 75.0%103640.1%– 15.8%136120203BMW M120.0%n/a –40.0%+ 300.0%280307204BMW M520.0%new188200.0%new207270205Forthing U-Tour20.0%n/a148710.2%+ 1320.0%129195206Honda Jazz20.0%n/a190190.0%+ 137.5%211213207Hyundai Ioniq 920.0%new –20.0%new322 –208KG Mobility Rexton20.0%n/a –110.0%+ 0.0%245217209Kia Picanto20.0%– 85.7%194620.2%– 72.6%14061210Land Rover Defender20.0%– 33.3%228370.1%+ 184.6%179190211Lexus NX20.0%– 60.0%196190.0%– 47.2%212158212Lexus UX20.0%+ 0.0% –100.0%+ 42.9%247249213Mazda CX-8020.0%new197250.1%new198245214Mini Countryman20.0%– 33.3% –190.0%– 29.6%213175215Mitsubishi Space Star20.0%– 87.5% –470.1%– 56.9%15595216Opel Vivaro20.0%n/a130140.0%+ 7.7%229228217Volvo EX3020.0%– 33.3%123300.1%+ 7.1%192177218VW Crafter20.0%n/a134290.1%+ 107.1%193223219Alfa Romeo Stelvio10.0%n/a185200.0%– 16.7%206179220Alpine A29010.0%new164110.0%new241 –221Audi S510.0%n/a –130.0%+ 1200.0%231278222Audi S610.0%– 50.0% –60.0%+ 200.0%265295223Audi SQ510.0%n/a18650.0%+ 400.0%271320224BMW 4 Series10.0%– 75.0%166170.0%– 39.3%221184225BMW M410.0%– 66.7%187180.0%– 5.3%215193226BMW M710.0%+ 0.0% –40.0%– 77.8%281199227BMW X210.0%n/a145330.1%+ 73.7%186188228BMW X710.0%– 75.0%170190.0%– 47.2%209169229BYD Seal U10.0%new –10.0%new356 –230Citroen C4 X10.0%+ 0.0%218110.0%– 66.7%242170231Ferrari 12 Cilindri10.0%new –10.0%new357 –232Ferrari Roma Spider10.0%n/a22320.0%n/a311 –233Fiat Ducato10.0%+ 0.0% –110.0%– 15.4%243230234Ford Mustang10.0%– 66.7%22690.0%+ 12.5%254250235Ford Transit10.0%n/a –40.0%– 50.0%283258236Forthing S710.0%new –20.0%new312 –237Geely EX510.0%new –120.0%new235 –238Jeep Grand Cherokee10.0%+ 0.0% –50.0%+ 400.0%274330239Kia EV610.0%+ 0.0% –140.0%+ 100.0%228234240Kia Proceed10.0%n/a175150.0%– 34.8%226187241Kia Sorento10.0%+ 0.0%195180.0%– 40.0%217168242Lynk & Co 0810.0%new15550.0%new275 –243Mercedes CLE10.0%– 75.0% –70.0%– 56.3%260208244Mercedes EQA10.0%n/a23070.0%– 12.5%261246245Mercedes EQE10.0%+ 0.0% –30.0%– 78.6%296211246Mercedes G-Class10.0%n/a157130.0%+ 44.4%232253247Mercedes GLS10.0%– 66.7%200130.0%+ 30.0%233248248Mercedes Vito10.0%+ 0.0%151120.0%+ 50.0%238241249Morgan Plus Four10.0%new –10.0%new358 –250Nissan Ariya10.0%n/a –30.0%– 57.1%299256251Opel Combo10.0%– 80.0%203550.1%+ 66.7%147162252Opel Zafira10.0%n/a –10.0%n/a355 –253Porsche Taycan10.0%– 50.0%235100.0%+ 25.0%249226254Range Rover Evoque10.0%– 75.0%236100.0%+ 11.1%250242255Renault Kangoo10.0%+ 0.0%180260.1%– 54.4%195129256Renault Rafale10.0%– 66.7%237400.1%+ 135.3%175191257Subaru Crosstrek10.0%+ 0.0%182180.0%+ 157.1%219237258VW ID.510.0%+ 0.0% –30.0%– 85.7%303197259VW ID.Buzz10.0%n/a –20.0%+ 100.0%321280
Source: ADS SLO

More Stories
Powerful Reasons Mercedes-AMG’s Latest GT Project Matters More Than You Think
From its base in Affalterbach, Mercedes-AMG has, recently, lifted the lid on a striking new direction for its GT line-up....
Top 5 Brands for Tailor-Made Car Accessories
Your vehicle deserves accessories that match your unique style and specific needs. While mass-produced car accessories serve basic functions, tailor-made...
How Car Finance Protects Your Buying Power in 2026
For many UK buyers, financing a vehicle isn’t just a way to “afford” a better car. It can be a deliberate choice to keep cash...
Hyundai Venus and Earth Concepts Signal a Bold New Ioniq Future for China
Hyundai has never been shy about taking a design risk, but the new Venus and Earth concepts feel like a...
A Chance To Win Tickets To The Wonderful Concours des Légendes 2026
We are delighted to offer you, our readers, another exciting competition. Are you signed up to our newsletter here, and...
How CGI Transforms Automobile Design & Prototyping
Car design has always depended on a mix of imagination, engineering, and revision. A sketch can set the direction, but...