
Germany September 2025: VW Golf back in charge, BYD smashes all records
First Top 50 finish in Germany for the BYD Seal U.
235,528 new cars hit German roads in September, a splendid 12.8% year-on-year lift. The year-to-date tally is now down just -0.3% to 2,110,348. The monthly market is slowly but surely getting back to pre-pandemic levels (244,622 sales in September 2019) but remain well below year-to-date (2,740,158 in 2019). Volkswagen (+16.2%) is the only Top 8 carmaker to beat the market to 19.2% share, still lower than its YTD level of 19.9%. Mercedes (+10.6%) and BMW (+8.6%) follow while Skoda (+9.6%) passes Audi (+5.3%) to return to #4.
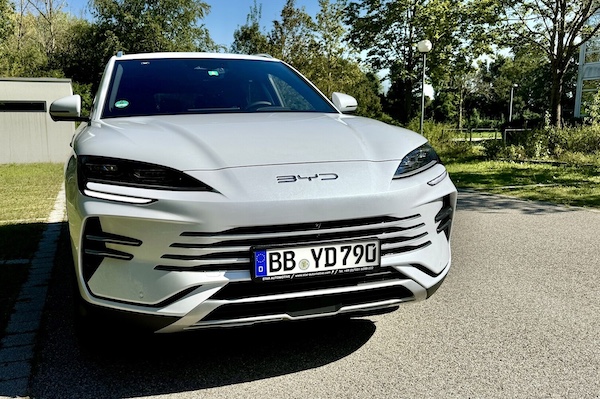
For once Opel (+10.2%) is in positive, distancing Ford (+7%) and Toyota (+10.9%). Hyundai (+17.3%) shines but just outside the Top 10 it’s Cupra (+84.6%) and Dacia (+39.5%) that deliver the most impressive results. Citroen (+52.1%) and Renault (+30.9%) also impress. Telsa is down -9.4% to #20. At #21 with 3,255 sales and 1.4% share, BYD (+2225%!) smashes all its records (previous bests #25 with 1,857 sales and 0.8% share last May). We welcome Deepal (#55) and Omoda (#63) in the charts.
Over in the models ranking, after two months dominated by the VW T-Roc, the VW Golf (+19.1%) returns to the pole position with over 1,200 sales more than the T-Roc (+67.9%), still impressive year-on-year. #1 a year ago, the VW Tiguan (-26%) is handicapped by the success of its 3-row sibling, the Tayron up to a record #14. The Opel Corsa (+25.2%) continues on a very solid year at #4, a ranking it also holds YTD vs. #7 over the Full Year 2024. The Passat (+14.8%) and Polo (+13%) match the market and make it five VWs in the Top 6. The VW ID.3 (+146.6%) cracks the Top 10 for the 5th time ever (#3 in December 2020, #5 in August 2021, #6 in December 2022 and #3 in June 2024).
Previous month: Germany August 2025: VW T-Roc repeats at #1, teases Golf YTD
One year ago: Germany September 2024: VW Tiguan signs first ever pole position
Full September 2025 Top 63 All brands and Top 346 All models below.
Germany September 2025 – brands:
PosBrandSep-25%/24Aug2025%/24PosFY241Volkswagen45,22519.2%+ 16.2%1420,62819.9%+ 3.9%112Mercedes20,3388.6%+ 10.6%2191,0989.1%+ 1.8%223BMW19,3888.2%+ 8.6%3181,6008.6%+ 6.9%334Skoda18,8728.0%+ 9.6%5165,7197.9%+ 7.0%445Audi15,7286.7%+ 5.3%4145,9756.9%– 4.0%556Opel12,3245.2%+ 10.2%699,2884.7%– 12.1%667Ford9,0653.8%+ 7.0%783,0583.9%+ 7.8%788Toyota7,9873.4%+ 10.9%1061,9382.9%– 7.9%1099Hyundai7,5043.2%+ 17.3%869,9413.3%– 3.4%81010Seat7,3423.1%– 4.1%965,2953.1%– 21.1%9711Cupra5,9052.5%+ 84.6%1157,8452.7%+ 67.4%111812Dacia5,7032.4%+ 39.5%1253,5812.5%+ 1.4%121113Kia5,2082.2%– 2.2%1345,9522.2%– 13.5%131214Renault5,0782.2%+ 30.9%1642,9772.0%+ 14.7%161615Peugeot4,4281.9%– 19.7%1543,5802.1%– 9.9%151316Fiat4,4001.9%+ 17.1%1441,9772.0%– 14.2%171517Citroen4,3151.8%+ 52.1%1737,0141.8%– 10.7%181718Volvo4,0261.7%– 8.8%1844,9402.1%– 1.6%141419Mazda3,8091.6%– 0.9%2029,3781.4%– 12.5%191920Tesla3,4041.4%– 9.4%2514,8450.7%– 50.3%262021BYD3,2551.4%+ 2225.0%2611,8180.6%+ 560.2%273722Nissan3,2371.4%+ 42.1%2225,1411.2%+ 9.5%202323Mini3,0721.3%– 24.7%1925,0851.2%+ 3.6%212224MG Roewe2,6151.1%+ 269.9%2118,2610.9%+ 9.1%232625Porsche2,2471.0%+ 4.7%2323,3081.1%– 16.7%222126Suzuki2,2260.9%– 13.8%2417,5910.8%– 9.8%242527Mitsubishi1,1190.5%– 34.1%2915,7070.7%– 28.5%252428Leapmotor9100.4%new304,4410.2%new325529Jeep8640.4%– 5.0%289,7480.5%+ 10.7%292930Land Rover8630.4%+ 15.1%2710,1150.5%+ 8.8%282831Honda6770.3%+ 3.8%315,7590.3%+ 3.4%313032Alfa Romeo5510.2%+ 70.1%325,7730.3%+ 19.0%303133Smart4500.2%– 24.9%333,2250.2%– 68.6%352734Lexus3910.2%– 25.4%343,6700.2%– 0.0%333235Polestar3480.1%+ 16.8%353,2710.2%+ 31.2%343536Subaru3390.1%– 5.0%363,2050.2%– 4.0%363337Xpeng2410.1%+ 630.3%371,8550.1%+ 1541.6%405038KGM2380.1%+ 147.9%382,2990.1%+ 62.4%373839DS1620.1%– 1.2%402,2640.1%+ 0.8%393440Ferrari1160.0%+ 33.3%411,4160.1%– 8.5%414041Man1020.0%+ 18.6%391,1290.1%+ 3.6%424142GWM690.0%– 73.4%482,2810.1%+ 5.9%383643Alpine530.0%+ 278.6%436820.0%+ 92.1%464844Lamborghini500.0%– 31.5%449720.0%– 0.7%434245Iveco490.0%+ 11.4%456980.0%– 14.4%454446Lynk & Co450.0%+ 1400.0%505820.0%+ 1041.2%476047Aston Martin340.0%+ 466.7%472220.0%– 5.5%535448Vinfast330.0%+ 73.7%591210.0%+ 55.1%575649Bentley290.0%+ 480.0%514300.0%– 17.3%494550Maserati280.0%– 39.1%465310.0%+ 25.2%484651Rolls-Royce260.0%+ 18.2%492570.0%+ 3.6%515352NIO200.0%– 9.1%522110.0%– 34.7%544953Genesis 150.0%– 59.5%428230.0%+ 26.6%444354Lotus130.0%– 50.0%562550.0%– 0.8%525255Deepal120.0%new –120.0%new63 –56Ineos100.0%– 56.5%574180.0%+ 6.6%504757Lucid 50.0%– 87.8%551410.0%+ 11.0%565158Cadillac30.0%– 72.7%60680.0%– 54.1%595759Morgan30.0%+ 50.0%61460.0%– 13.2%606160Maxus20.0%– 33.3%58880.0%+ 66.0%585961Fisker20.0%n/a –40.0%– 97.0%645862Togg10.0%new53250.0%new62 –63Omoda10.0%new –10.0%new68 – –Others9530.4%+ 23.0% –9,3300.4%+ 5.3% – –
Germany September 2025 – models:
PosModelSep-25%/24Aug2025%/24PosFY241VW Golf7,4863.2%+ 19.1%262,8513.0%– 17.7%112VW T-Roc6,2562.7%+ 67.9%161,2802.9%+ 6.0%223VW Tiguan4,9822.1%– 26.0%348,5452.3%– 1.1%334Opel Corsa4,4151.9%+ 25.2%436,5061.7%+ 16.4%475VW Passat3,8451.6%+ 14.8%1034,5891.6%– 5.1%556VW Polo3,6341.5%+ 13.0%921,5741.0%– 26.3%22107Skoda Octavia3,1231.3%– 13.3%1133,2171.6%– 16.5%648Mini All3,0721.3%– 24.7%825,0851.2%+ 3.6%16149Audi A32,9951.3%+ 54.4%723,8921.1%+ 3.2%171810VW ID.32,9791.3%+ 146.6%1522,8591.1%+ 40.1%194911BMW X32,9111.2%+ 0.0%2217,7790.8%– 15.7%352312Mercedes GLC2,8541.2%+ 22.6%1626,4791.3%+ 18.8%101513Seat Leon2,8351.2%+ 37.0%629,0391.4%+ 1.6%8914VW Tayron2,8041.2%new4018,2610.9%new3336115BMW 1er2,7771.2%+ 183.1%2318,4880.9%+ 27.5%315216Skoda Karoq2,6531.1%+ 9.8%2821,1611.0%– 10.3%251617Opel Astra2,6391.1%– 30.2%1726,0161.2%– 30.0%12618VW Transporter2,6241.1%+ 39.4%1925,2381.2%– 6.1%141219VW ID.72,5971.1%– 2.8%3325,0961.2%+ 243.9%156920BMW 3er2,5801.1%– 0.0%1423,6571.1%– 12.7%181121Skoda Kodiaq2,5731.1%+ 25.0%2721,9621.0%+ 29.6%213222Skoda Elroq2,5651.1%new3216,0710.8%new4135223Toyota Aygo X2,4771.1%+ 94.9%6012,7540.6%– 1.5%555624Toyota Yaris/Cross2,4521.0%– 9.6%1221,2101.0%– 5.9%241325Audi A62,2941.0%– 19.9%1326,2971.2%+ 46.9%112926Audi A52,2421.0%+ 216.7%3417,7340.8%+ 112.5%368027BMW 5er2,2280.9%+ 32.5%2025,9201.2%+ 52.3%132828Tesla Model Y2,2270.9%– 27.4%1029,8470.5%– 58.3%741929Skoda Fabia2,1860.9%+ 13.0%3718,9640.9%– 11.4%302430Audi Q52,1430.9%+ 44.6%3513,4190.6%+ 9.0%495831Mercedes A-Klasse 2,0620.9%+ 55.7%5413,0040.6%+ 1.5%535732Fiat Ducato2,0610.9%+ 26.4%1826,8391.3%+ 18.1%92733BMW 2er2,0230.9%+ 19.7%5014,6070.7%– 3.2%465034Opel Mokka2,0150.9%+ 27.8%4916,1300.8%+ 1.5%404035Mercedes CLA-Klasse1,9890.8%+ 89.4%3811,7180.6%– 6.5%626036BMW X11,9680.8%– 43.5%533,0591.6%+ 28.9%7837Dacia Sandero1,9520.8%– 0.9%3020,0681.0%– 13.1%271738Ford Puma1,8650.8%+ 1.2%5112,6430.6%– 14.1%565539Skoda Kamiq1,8640.8%– 0.3%3617,1590.8%– 0.3%373340Nissan Qashqai1,8470.8%+ 125.0%7211,7600.6%+ 22.4%618241Mercedes E-Klasse 1,8270.8%– 10.3%2419,0660.9%+ 6.4%293142Volvo XC601,7620.7%+ 32.0%3916,9040.8%+ 13.6%383743BYD Seal U1,7450.7%+ 5917.2%1315,1880.2%+ 1720.4%12527344Skoda Enyaq1,7340.7%– 49.1%4818,4850.9%+ 11.3%323045Seat Ibiza1,7210.7%+ 11.3%2913,3830.6%– 21.5%504546Opel Grandland X1,6940.7%+ 10.6%4312,0040.6%– 16.0%585147VW ID.4, ID.51,6520.7%– 16.2%3121,2201.0%+ 39.7%233948Mercedes C-Klasse 1,6350.7%– 15.9%5219,1900.9%– 6.5%282549BMW X51,6340.7%+ 63.6%579,9110.5%+ 4.4%727650Kia Ceed/Xceed1,6310.7%+ 0.0%5812,9040.6%– 20.6%544751Cupra Born1,5920.7%+ 6.1%6814,8590.7%+ 35.8%446252Ford Transit Custom1,5480.7%+ 91.1%2618,1750.9%+ 175.2%349453VW T-Cross1,5420.7%+ 17.1%2122,7501.1%+ 1.7%202254Skoda Superb1,5370.7%+ 21.6%6913,1840.6%+ 8.5%526155Cupra Terramar1,5190.6%+ 30280.0%4113,3110.6%+ 266120.0%5125056Mercedes GLA1,5190.6%+ 38.1%6310,2070.5%+ 16.0%717557Cupra Formentor1,4980.6%+ 13.2%2520,8631.0%– 9.3%262158Mazda CX-301,4760.6%+ 132.1%929,2560.4%+ 45.1%7710059Seat Arona1,4670.6%– 5.5%6212,0000.6%– 22.4%595460VW Caddy1,4570.6%– 0.5%6114,7720.7%+ 7.0%455361Hyundai Tucson1,4420.6%+ 18.7%4214,5780.7%– 7.8%473862Opel Frontera1,4090.6%+ 5770.8%456,6190.3%+ 27479.2%10732763Citroen C3/C3 Aircross1,3980.6%+ 737.1%4411,4230.5%– 24.1%666464Hyundai Kona1,3190.6%– 1.6%5910,7940.5%+ 5.7%697365Seat Ateca1,3140.6%– 43.8%7910,7490.5%– 38.4%703566Hyundai i101,3060.6%+ 11.9%6411,4710.5%+ 0.7%656767Cupra Tavascan1,2960.6%+ 251.2%848,8120.4%+ 1631.2%8321168Ford Focus1,2650.5%– 29.4%6713,7820.7%– 20.4%483669Audi Q31,2620.5%– 9.6%5612,6040.6%– 26.4%574370BMW 4er1,2620.5%– 3.4%5316,3610.8%– 2.1%393471Dacia Bigster1,2190.5%new557,7520.4%new91 –72Audi A11,2080.5%+ 3.5%709,5170.5%+ 0.0%757473Mercedes B-Klasse1,1970.5%+ 28.3%776,6380.3%+ 10.2%10410874Citroen C4/C4 X1,1910.5%+ 9.7%836,0870.3%– 26.5%1138175Peugeot 2081,1850.5%– 19.2%8211,3040.5%+ 20.6%676376Tesla Model 31,1730.5%+ 92.9%954,8630.2%– 13.8%12911777Ford Kuga1,1720.5%– 29.0%4611,5810.5%– 31.8%634278Fiat 5001,1640.5%+ 35.8%816,6650.3%– 66.4%1034679Dacia Duster1,1560.5%+ 7.9%7311,9260.6%– 25.5%604180Peugeot 20081,0520.4%– 21.1%769,0000.4%– 23.8%816881Renault Austral1,0440.4%+ 77.9%986,8840.3%+ 37.1%10111282Suzuki Vitara1,0260.4%+ 30.4%1055,6160.3%+ 17.1%11812183Ford Explorer1,0210.4%+ 71.3%667,6230.4%+ 382.8%9216984Toyota Corolla/Cross1,0180.4%– 18.9%789,1870.4%– 26.6%795985Dacia Jogger1,0140.4%+ 4.1%969,8720.5%– 9.4%736686VW Taigo1,0120.4%– 38.5%7115,7830.7%– 25.8%432687Audi Q29550.4%– 11.2%858,5800.4%– 18.7%857088VW Touran9470.4%– 51.1%8810,8470.5%– 26.2%684889Volvo XC409460.4%+ 20.2%7411,5300.5%+ 35.4%648690Mercedes GLE9390.4%+ 10.9%808,5990.4%– 19.9%847791Renault Clio9190.4%– 12.1%1068,0700.4%+ 1.2%878792Toyota C-HR9110.4%+ 5.3%1107,2690.3%– 7.6%968893Kia Sportage9010.4%– 25.4%879,4580.4%– 20.6%766594Mercedes V-Klasse/EQV8950.4%– 12.8%4715,9800.8%+ 3.0%424495Suzuki Swift8710.4%+ 33.0%1048,9430.4%+ 46.7%8210196Mercedes EQA8540.4%+ 2.5%907,2830.3%– 6.9%958597Citroen C5 X/Aircross8420.4%+ 101.9%1007,2280.3%+ 2.7%979398Hyundai Inster8350.4%new868,0510.4%new8936599Kia EV38260.4%new916,7970.3%new102275100Mercedes Sprinter8040.3%+ 46.7%898,0690.4%+ 18.3%88105101Mazda CX-607690.3%+ 231.5%1076,6190.3%+ 66.2%108123102Audi Q47610.3%– 34.6%659,2140.4%– 11.5%7878103Hyundai i207410.3%+ 0.0%1097,3930.4%– 22.9%9484104MG 37400.3%+ 383.7%1574,1560.2%+ 675.4%137185105Ford Transit Connect7250.3%+ 40.8%1194,5030.2%+ 1.9%134128106Renault Captur7150.3%+ 4.4%1235,8870.3%+ 19.6%116115107Mercedes CLE6750.3%– 1.6%1247,8690.4%+ 47.2%90114108Ford Transit, Tourneo6730.3%+ 11.4%937,6110.4%– 12.1%9392109Fiat 6006700.3%+ 15.7%1035,4420.3%+ 278.2%121153110Kia Picanto6700.3%– 9.2%976,9660.3%– 2.7%9995111VW ID.Buzz6690.3%+ 12.4%1206,3960.3%+ 132.5%109141112Porsche Macan6670.3%+ 18.3%1494,6950.2%+ 0.8%132118113MG ZS6630.3%+ 171.7%1174,1600.2%+ 36.0%136158114Volvo XC906550.3%– 28.3%1226,9370.3%+ 8.9%10099115Peugeot 30086370.3%– 3.9%1016,6330.3%– 16.2%10691116Skoda Scala6320.3%– 3.7%1305,4930.3%– 22.1%120102117Leapmotor T036300.3%new1083,2270.2%new150311118Audi Q66200.3%+ 119.1%759,1660.4%+ 596.0%80170119Toyota RAV46080.3%+ 19.0%1433,0960.1%– 29.8%153127120Mazda35900.3%+ 129.6%1293,6140.2%+ 39.4%144156121Audi Q85750.2%+ 69.6%1156,1080.3%+ 96.2%112133122Porsche 9115650.2%+ 48.7%1218,2160.4%+ 3.2%8696123Mercedes GLB5620.2%– 4.6%1115,1140.2%– 11.2%127111124Nissan X-Trail5540.2%+ 15.4%1723,5960.2%– 13.2%145134125Hyundai Ioniq55390.2%+ 6.3%1185,4330.3%– 13.7%122113126MG RX65360.2%+ 1524.2%994,1220.2%+ 246.7%138186127Nissan Juke5290.2%+ 14.3%1375,1520.2%+ 0.4%126120128Peugeot 3085280.2%– 47.6%1346,0440.3%– 34.9%11479129Jeep Avenger5110.2%+ 37.7%1165,3730.3%+ 74.9%123140130BYD Seal5040.2%+ 1129.3%1601,6450.1%+ 270.5%190265131Citroen Jumper5040.2%– 29.7%1266,2740.3%– 21.0%11097132Mercedes G-Klasse5040.2%+ 47.4%1324,8760.2%+ 12.5%128124133MG 45040.2%+ 107.4%1254,7120.2%– 57.2%13183134Porsche Cayenne4780.2%– 16.0%1275,2540.2%– 32.9%12498135Mitsubishi Outlander4680.2%n/a1701,7780.1%n/a185 –136Hyundai i304620.2%– 42.0%1145,7620.3%– 44.5%11771137Mercedes Vito4600.2%– 7.3%947,0440.3%+ 5.9%98106138VW Touareg4600.2%– 6.1%1514,7700.2%– 5.7%130119139Renault 54570.2%+ 45600.0%1125,9810.3%+ 22903.8%115244140Mercedes EQB4350.2%– 41.1%1285,4940.3%+ 8.1%119110141Renault Rafale4040.2%+ 201.5%1762,6470.1%+ 264.1%164206142BMW X23790.2%– 31.3%1136,2460.3%+ 65.5%111122143Ford Capri3720.2%new1392,3010.1%new169281144Mazda23680.2%– 57.8%1413,6240.2%– 49.5%143107145Audi Q73620.2%– 6.2%1533,8540.2%+ 71.7%142150146Dacia Spring3590.2%+ 11866.7%1543,9240.2%+ 57.1%140157147Renault Symbioz3510.1%+ 156.2%1642,5300.1%+ 482.9%167218148Mitsubishi ASX3490.1%+ 37.9%1382,7050.1%– 36.9%162137149BYD Dolphin Surf3440.1%new2041,3710.1%new201 –150Mercedes EQE3360.1%– 55.8%1364,2540.2%– 31.6%135104151Peugeot 50083360.1%– 25.0%1333,3110.2%– 18.7%149131152Alfa Romeo Junior3280.1%+ 993.3%1613,1230.1%+ 3331.9%152289153BMW iX3140.1%+ 5.7%1652,7320.1%– 7.7%161155154Mercedes Citan3020.1%+ 65.9%1354,0670.2%+ 36.8%139146155Mitsubishi Colt3010.1%+ 52.8%1553,3170.2%– 20.8%148139156Renault Arkana2990.1%– 25.6%2011,9570.1%– 25.8%179152157Hyundai Bayon2930.1%+ 0.3%1622,3120.1%– 33.0%168145158Peugeot 4082910.1%+ 75.3%1423,1570.1%+ 108.0%151188159Ford Transit Courier2850.1%– 24.0%1443,0190.1%+ 14.5%157154160Land Rover Defender2790.1%+ 32.2%1503,0420.1%+ 29.9%155164161Hyundai Santa Fe2700.1%+ 69.8%1882,2470.1%+ 120.5%170202162BMW X42670.1%– 9.8%1732,1830.1%– 35.7%172144163Fiat Grande Panda2670.1%new1639490.0%new224 –164Kia EV62650.1%– 47.7%1682,5440.1%– 37.2%166132165Citroen Jumpy2630.1%– 1.1%1593,4280.2%+ 135.0%146189166Leapmotor C102580.1%new1751,1910.1%new211375167Honda Civic2560.1%+ 255.6%2469180.0%+ 17.1%227243168Kia Stonic2560.1%– 31.6%1692,7760.1%– 33.3%159130169BMW X72550.1%+ 7.6%1772,1570.1%– 12.4%174163170BMW X62480.1%– 9.5%1662,0980.1%– 21.5%177159171Mazda62470.1%+ 9.8%1968010.0%– 65.8%236172172Porsche Taycan2460.1%– 34.6%1852,1560.1%– 12.2%175151173Toyota bZ4X2460.1%+ 113.9%1404,5930.2%+ 265.4%133214174Toyota Proace2340.1%– 37.6%1583,0590.1%– 24.8%154126175VW Crafter2310.1%– 16.6%1802,6820.1%– 19.8%163149176Kia EV42280.1%new –2280.0%new296 –177BYD Sealion 72230.1%new1931,0690.1%new218350178Renault Kangoo2220.1%+ 0.5%1473,0330.1%– 20.7%156136179Volvo S/V602190.1%– 68.9%1483,4170.2%– 43.4%147109180Kia Niro2180.1%– 51.0%1451,6560.1%– 66.5%189129181Jeep Compass2170.1%– 49.2%1522,8780.1%– 14.9%158147182Smart #52130.1%new1877420.0%new245 –183Mazda CX-802120.1%+ 271.9%1822,1320.1%+ 3513.6%176247184Porsche Panamera2050.1%+ 75.2%2191,5840.1%+ 4.3%194195185Polestar 42020.1%+ 4.1%1791,6790.1%+ 418.2%188257186Peugeot Expert2010.1%+ 813.6%1461,7900.1%+ 728.7%184294187Volvo EX301910.1%– 62.3%1983,8840.2%– 47.4%141103188Suzuki SX41890.1%– 65.8%1781,8520.1%– 32.7%181162189Mercedes S-Klasse1810.1%+ 44.8%1672,1600.1%– 14.3%173168190BMW 7er1790.1%+ 13.3%2031,6120.1%– 26.1%192171191Range Rover Evoque1780.1%+ 4.7%1811,7630.1%+ 12.2%187190192Renault Espace1760.1%+ 8.0%1741,8320.1%+ 9.6%182181193BYD Dolphin1710.1%+ 489.7%3036270.0%+ 97.8%252280194Honda Jazz1630.1%+ 40.5%2111,3620.1%+ 62.7%202234195Renault 41590.1%new1907820.0%new240 –196Kia Sorento1580.1%– 9.2%1911,4640.1%– 49.2%199161197Range Rover Sport1580.1%+ 13.7%1922,0890.1%+ 26.7%178193198Nissan Townstar1570.1%– 39.1%1832,1890.1%+ 19.5%171183199BYD Atto 31550.1%+ 369.7%2669090.0%+ 78.9%228236200Renault Scenic1530.1%+ 14.2%2171,3730.1%+ 48.0%200201201Peugeot Boxer1500.1%– 6.8%1941,7760.1%– 23.6%186174202Lexus LBX1450.1%– 19.4%1971,0990.1%+ 20.5%214226203Mercedes GLS1440.1%– 16.3%1841,5380.1%– 45.1%195160204Xpeng G61410.1%+ 2250.0%1861,0120.0%+ 16766.7%221318205Volvo EX901400.1%new2141,0210.0%new220330206Honda HR-V1350.1%+ 1.5%2441,2080.1%– 1.9%209204207Smart #11340.1%– 70.4%2001,6170.1%– 71.5%191116208Subaru Forester1330.1%+ 9.0%2061,1420.1%+ 19.7%213215209Polestar 21300.1%+ 120.3%2161,1920.1%– 41.0%210184210BMW Z41250.1%– 33.5%1892,7380.1%+ 0.0%160165211Fiat Ulysse1250.1%+ 12400.0%2452250.0%+ 837.5%297364212MG S51250.1%new2313600.0%new278 –213DS 71180.1%– 16.3%2051,5980.1%+ 7.0%193182214Citroen Berlingo1170.0%– 36.4%1712,5710.1%+ 54.7%165173215Alfa Romeo Stelvio1140.0%– 17.4%2091,2520.1%– 32.2%206187216Hyundai Staria1140.0%+ 78.1%2187900.0%– 64.0%239177217Renault Trafic1120.0%+ 51.4%2071,0770.1%– 50.9%217166218Hyundai Ioniq91070.0%new2152630.0%new290 –219Lexus NX1060.0%+ 3.9%2309910.0%– 6.6%223205220Mazda MX-51050.0%– 37.1%1991,0590.1%– 23.5%219209221Smart #31020.0%– 28.7%2238590.0%– 40.8%231196222Opel Zafira Life1010.0%– 44.8%2329250.0%– 42.8%226197223Man TGE1000.0%+ 20.5%1951,0950.1%+ 5.5%215229224Range Rover 1000.0%+ 37.0%2081,2510.1%+ 8.6%207219225Subaru Outback980.0%– 10.9%2438120.0%– 15.1%234233226Subaru Crosstrek970.0%+ 12.8%2108250.0%+ 62.7%233255227Audi A8940.0%– 9.6%2129300.0%– 20.4%225212228KGM Tivoli930.0%+ 173.5%2227590.0%+ 61.1%241259229BYD Atto 2910.0%new2488740.0%new229 –230Fiat Panda880.0%– 86.4%2351,5190.1%– 55.7%196142231Volvo S/V90870.0%– 23.0%2548020.0%– 50.3%235199232BMW 8er850.0%+ 25.0%2247440.0%– 33.7%244231233Ford Mustang840.0%– 35.9%2261,2230.1%– 1.1%208221234Xpeng G9830.0%+ 245.8%2287220.0%+ 780.5%247302235BMW XM820.0%– 15.5%2385310.0%– 42.0%260232236Nissan Primastar820.0%– 32.2%2131,5030.1%+ 24.2%198213237Mercedes EQS790.0%– 53.8%2021,0780.1%– 42.6%216179238Hyundai Ioniq6740.0%– 34.5%2528000.0%– 60.2%237180239Jeep Wrangler720.0%+ 20.0%2637990.0%– 12.0%238235240Range Rover Velar700.0%– 4.1%2271,1450.1%– 21.5%212200241Audi A7690.0%– 33.7%2341,2740.1%+ 28.6%204207242Audi e-Tron GT640.0%– 40.7%2378420.0%– 24.1%232228243Alfa Romeo Tonale630.0%– 34.4%2256480.0%– 61.9%251192244KGM Rexton580.0%+ 286.7%2703360.0%+ 5.7%281286245Suzuki Swace580.0%+ 34.9%2216830.0%+ 49.1%248260246Jeep Renegade550.0%+ 27.9%2595920.0%– 56.4%256210247Lexus RX550.0%– 42.1%2495040.0%– 30.4%264238248Mercedes AMG GT540.0%– 42.6%2207570.0%– 28.1%242227249Honda CR-V530.0%– 75.3%1561,5100.1%+ 21.7%197208250Honda ZR-V520.0%– 52.7%2416620.0%– 3.8%250248251Land Rover Discovery Sport510.0%– 17.7%2565820.0%– 22.5%257241252MG Cyberster510.0%+ 264.3%2423410.0%+ 2335.7%280376253Kia EV9470.0%– 64.9%2291,0110.0%– 3.0%222223254Alfa Romeo Giulia460.0%– 23.3%2337500.0%– 38.0%243220255Iveco Daily460.0%+ 4.5%2536760.0%– 13.8%249242256Alpine A290440.0%new2364910.0%new267371257Peugeot Rifter440.0%+ 120.0%2714330.0%+ 64.6%272285258Renault Megane440.0%– 29.0%2623640.0%– 84.6%276175259Nissan Ariya420.0%– 63.8%2618680.0%+ 103.3%230249260Lexus UX410.0%– 21.2%2604500.0%– 0.7%269254261Lamborghini Urus400.0%+ 14.3%2407270.0%+ 35.6%246263262Ford Mustang Mach-E390.0%– 73.5%3013060.0%– 82.8%286194263GWM Wey 05390.0%– 29.1%2796220.0%+ 1.1%253256264Mazda MX-30380.0%– 61.6%2513530.0%– 67.9%279222265Porsche Cayman370.0%– 7.5%2644980.0%– 48.0%266237266DS 4360.0%+ 80.0%2785370.0%– 11.8%259245267KGM Korando360.0%+ 2.9%2775600.0%+ 90.5%258277268Ferrari 12Cilindri340.0%new2582330.0%new295395269Lexus RZ310.0%+ 29.2%2883610.0%+ 276.0%277314270Opel Combo290.0%– 70.4%2475950.0%– 59.4%255203271Ferrari Roma280.0%+ 86.7%2652580.0%– 19.1%292290272KGM Actyon270.0%new2732600.0%new291 –273Land Rover Discovery270.0%+ 35.0%2932390.0%– 32.3%294276274Lynk & Co 08270.0%new296450.0%new341 –275Vinfast VF6270.0%new322460.0%new339382276Volvo C40260.0%– 50.9%2974380.0%– 51.1%270239277Ferrari 296 GTB250.0%– 7.4%2684340.0%– 8.8%271266278Fiat Tipo250.0%– 40.5%2573090.0%– 78.5%285217279KGM Torres240.0%+ 100.0%2743840.0%+ 16.0%275261280Audi A4230.0%– 98.4%2391,7980.1%– 93.1%18320281Ferrari Purosangue230.0%– 36.1%2722850.0%– 5.9%287284282GWM Wey 03230.0%– 32.4%2912700.0%+ 128.8%288309283Renault Master230.0%– 73.9%2555290.0%– 54.9%261225284Leapmotor B10220.0%new –220.0%new355 –285Mercedes SL220.0%– 92.6%2675160.0%– 56.7%262230286Bentley Continental210.0%n/a2843100.0%– 18.4%284274287BYD Tang210.0%+ 600.0%3041180.0%+ 156.5%316349288Maserati Grecale210.0%– 4.5%2753330.0%+ 48.7%282296289Opel Movano210.0%– 36.4%2813140.0%– 32.5%283267290NIO ET5170.0%+ 183.3%300650.0%– 33.0%332324291Xpeng P7170.0%+ 466.7%2981210.0%+ 572.2%313358292Polestar 3160.0%– 64.4%2763990.0%+ 167.8%274300293Toyota Prius140.0%– 33.3%2821410.0%– 15.6%309303294Toyota Land Cruiser130.0%– 18.8%2835080.0%– 4.3%263216295Toyota Supra130.0%+ 30.0%316650.0%– 60.4%333301296Deepal S05110.0%new –110.0%new370 –297Honda E:NY1100.0%+ 100.0%305850.0%– 89.1%324252298Ineos Grenadier100.0%– 56.5%3024160.0%+ 6.1%273271299Lamborghini Coupe range100.0%– 73.7%2802450.0%– 44.7%293269300Lynk & Co 02100.0%new315340.0%new346 –301Rolls-Royce Spectre100.0%+ 233.3%332560.0%– 15.2%337336302Genesis GV6090.0%+ 50.0%2691190.0%+ 58.7%314326303Jeep Grand Cherokee90.0%+ 12.5%2871060.0%+ 26.2%319331304Alpine A11080.0%– 33.3%2941620.0%– 53.7%304282305Bentley Bentayga80.0%+ 60.0%2991190.0%– 19.6%315307306Lotus Eletre80.0%– 27.3%3071030.0%– 10.4%320306307Lynk & Co 0180.0%+ 166.7%2895030.0%+ 886.3%265344308Subaru Impreza80.0%+ 0.0%290800.0%+ 37.9%325340309GWM Ora 0770.0%+ 250.0%319450.0%– 39.2%342337310Lexus LM70.0%– 46.2%3061570.0%+ 118.1%306305311Suzuki Across70.0%– 72.0% –1470.0%+ 2.8%307297312DS No 860.0%new317290.0%new351 –313Vinfast VF860.0%– 62.5%348750.0%+ 1.4%328310314Genesis GV7050.0%– 64.3%3184530.0%+ 24.8%268264315Lucid Air50.0%– 87.8%3201280.0%+ 0.8%312287316Maserati GranTurismo50.0%+ 0.0%308760.0%+ 76.7%327348317VW Arteon50.0%– 94.5%3345960.0%– 84.9%254135318Ferrari SF90/Stradale40.0%– 20.0%2851770.0%– 25.0%302298319Lexus ES40.0%– 90.2%3101010.0%– 59.1%321292320Peugeot 50840.0%– 98.2%3211320.0%– 91.8%311191321Cadillac Escalade30.0%– 57.1%314650.0%– 24.4%334328322Mercedes Actros30.0%n/a329180.0%+ 80.0%358383323Tesla Model S30.0%– 94.4%346640.0%– 80.1%335291324Audi Q8 e-Tron20.0%– 99.1%3252640.0%– 93.4%289148325DS 320.0%+ 0.0%336750.0%– 43.6%329299326Fisker Ocean20.0%n/a –40.0%– 96.9%386319327Iveco Stralis20.0%n/a32390.0%n/a372 –328Lexus LS20.0%n/a –20.0%– 33.3%393390329Lotus Emeya20.0%– 50.0%313320.0%+ 68.4%347359330Man TGM20.0%+ 0.0% –140.0%– 36.4%362362331Mercedes Arocs20.0%n/a –130.0%– 35.0%365373332NIO Firefly20.0%new32460.0%new381 –333Dacia Logan10.0%– 98.6%335310.0%– 91.5%349272334Deepal S0710.0%new –10.0%new404 –335Genesis G8010.0%+ 0.0%337510.0%+ 37.8%338347336Kia PV510.0%new –10.0%new405 –337Lotus Emira10.0%– 90.0% –1130.0%+ 5.6%317317338Mercedes Atego10.0%+ 0.0%34180.0%– 60.0%374369339NIO ES810.0%– 50.0%343180.0%– 41.9%359354340Omoda 910.0%new –10.0%new406 –341Opel Zafira10.0%n/a –10.0%n/a407 –342Smart Forfour10.0%n/a –10.0%n/a408 –343Suzuki Ignis10.0%– 99.8% –2130.0%– 95.9%299125344Tesla Model X10.0%– 96.6%309690.0%– 74.6%331295345Togg T10X10.0%new292180.0%new360 –346Toyota Mirai10.0%– 97.4%333350.0%– 70.6%345312
Source: KBA


More Stories
Colombia February 2025: Kia Picanto repeats at #1, sales up 49.5%
The Kia Picanto is once again the most popular vehicle in Colombia. New vehicle sales in Colombia continue to surge,...
The Winner of Our Exciting Smallest Cog Goodies Bundle Competition!
Thank you for everyone that entered our Smallest Cog Goodies Bundle competition. Congratulations to our Smallest Cog Goodies Bundle competition...
Toyota’s Warning Shot Shows How Fast the Auto Industry Is Changing
Toyota is not a company that usually talks like it is on the ropes, which is exactly why this latest...
2026 Ram 1500 America250 Editions Turn Big Horn, Laramie, and Rebel Into Patriotic Special Trucks
Ram is leaning hard into Americana for the 2026 model year with a new batch of special-edition 1500 pickups created...
Wrongful Death After a Car Accident: Legal Rights of the Family
Car accidents have a devastating impact on one’s life. Even if you drive carefully, you have little control over other...
The Next Toyota Celica Rumored to Return as a Hybrid AWD Coupe
Toyota’s long-rumored Celica revival is starting to sound a lot more real, and a lot more modern, than many enthusiasts...