
France September 2025: BEVs at 22.3% share, Renault 4 (finally) breaks into Top 50
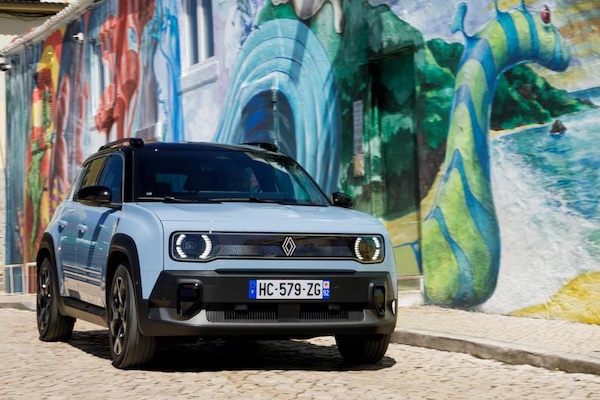
The Renault 4 finally is finally in the French Top 50, but we can’t call it a success just yet.
It’s a second consecutive month of year-on-year gains in France at +1% to 140,354 units. But there’s a couple of buts. As it was the case for August, the year-ago comparison base was low at -11.1% on the year prior. There is also one opening day more than September 2024 which means the market is actually down on a daily ratio (-3.6%). In any case, the year-to-date tally remains in frank negative at -6.2% to 1,186,785. Encouragingly and the sign of a healthy market, private sales are up 7% to 50% share whereas fleet sales drop -7% despite BEVs up 44% in that channel. 64% of private sales happen through leasing vs. 62% in August.
Petrol sales freefall -25.3% to 26,934 and 19.2% share vs. 25.9% in September 2024, diesel falls -21.7% to 6,311 and 4.5% share vs. 5.8% a year ago, HEVs soar 16.7% to 62,039 and 44.2% share vs. 38.2% last year and PHEVs drop -9.5% to 9,118 and 6.5% share vs. 7.3% a year ago. Finally BEVs surge 10.9% to 31,349 and 22.3% share vs. 20.3%. According to AAA Data, this is the highest BEV share ever in France. Over the first 8 months of the year, petrol is down -32.8% to 265,023 and 22.3% share vs. 31.1% over the same period in 2024, diesel is off -38.5% to 58,906 and 5% share vs. 7.6% last year, HEV is up 28.7% to 531,166 and 44.8% share vs. 32.6% and PHEV is down -26.8% to 72,537 and 6.1% share vs. 7.8%. BEV sales are now stable at -0.3% to 216,622 and 18.3% share vs. 17.2% in 2024.
MG goes from strength to strength and ranks #12 in September.
Both Renault (-1.6%) and Peugeot (-2.5%) can’t capitalise on the positive market and find themselves slightly below their YTD levels at 16.8% share vs. 17.3% and 13.4% vs. 14.3% respectively. Dacia (+23.7%) in contrast is on an absolute roll YoY but keep in mind its year-ago sales were off -31.4% on the year prior, so this is mainly a catching up on lost time. Citroen (+10.6%) is back up to #4 ahead of Volkswagen (-18%) and Toyota (-11.2%) both in great difficulty. At #7, Tesla (+2.7%) edges up on a traditionally strong end-of-quarter month but is still down -31.7% year-to-date at #16. Skoda (+9.9%) is solid and ranks at a highest ever #8, a position it holds for the 6th time, all in the past 12 months. Audi (+21.5%) for once is the #1 German premium brand above Mercedes (-0.8%) and BMW (-18%). MG gains 83.7% to #12, Cupra (+41.9%), Mini (+21%) and Nissan (+17.6%) also shine below while BYD is up 239.9%.
Looking at the models ranking, the Renault Clio V (+0.9%) edges up YoY but has to settle with 6.1% share vs. 6.4% year-to-date. Meanwhile the Peugeot 208 (-6.5%) continues to crater but is back up to #2 above the Dacia Sandero (+8.1%). The Citroen C3 IV (+35.1%) is up to #4 both for the month and year-to-date. The Elon Musk negative impact on Tesla sales is wearing off, as evidenced by the 5th place of the Tesla Model Y (+5.5%) this month, the nameplate’s highest ranking in France this year. The Peugeot 2008 (-0.6%), 3008 III (-1.8%) and Renault Captur (-14.7%) follow but all suffer. The Dacia Duster III (+2.1%) and Peugeot 308 (+10.3%) round out the Top 10. Both the Renault 5 (+130.4%) and Symbioz (+136.6%) improve their ranking on last month to #12 and #13 respectively. The Dacia Bigster (#16) and Citroen C3 Aircross II (#17) are the most popular recent launches while two other newcomers break into the Top 50: the Renault 4 (#42) and Opel Frontera (#49). This does not mean they are successful as we expect much higher scores for both models.
Full models data will be uploaded to this article when made available to us.
Previous month: France August 2025: Hyundai (+31%), Citroen (+30.8%) highlight first positive market of the year
One year ago: France September 2024: Sales down a concerning -11.1%
Full September 2025 Top 55 All brands and Top 50 models below.
France September 2025 – brands:
PosBrandSep-25%/24Aug2025%/24PosFY241Renault 23,55916.8%– 1.6%1205,76017.3%+ 1.1%112Peugeot 18,87313.4%– 2.5%2170,14214.3%– 4.1%223Dacia 12,1548.7%+ 23.7%3108,1219.1%+ 1.2%334Citroen 9,8127.0%+ 10.6%585,7957.2%– 2.5%465Volkswagen8,9756.4%– 18.0%678,8156.6%– 8.0%656Toyota8,5646.1%– 11.2%480,8836.8%– 12.6%547Tesla5,5844.0%+ 2.7%1820,1451.7%– 31.7%16148Skoda 4,6273.3%+ 9.9%936,0103.0%+ 17.0%8119Audi 4,4393.2%+ 21.5%1033,4712.8%– 5.0%9910Mercedes 4,3453.1%– 0.8%1230,3302.6%– 15.6%11811BMW 4,2263.0%– 18.0%742,7613.6%– 9.7%7712MG3,7112.6%+ 83.7%1520,8231.8%+ 54.1%151813Hyundai3,2382.3%– 5.4%831,4982.7%– 4.7%101014Ford 3,0662.2%– 7.5%1428,2892.4%– 17.1%121315Mini2,9202.1%+ 21.0%1618,5241.6%+ 29.6%182216Opel 2,8492.0%– 3.8%1325,3162.1%– 25.5%131517Kia 2,2041.6%– 35.1%1124,2852.0%– 27.1%141218Nissan 1,9941.4%+ 17.6%2019,4651.6%– 10.6%171719Cupra1,8771.3%+ 41.9%1916,0831.4%+ 33.2%192420Fiat 1,8191.3%– 12.3%2114,3761.2%– 46.5%211621Suzuki1,7871.3%+ 14.4%2214,5581.2%– 20.9%201922Seat 1,3761.0%– 18.2%2311,7201.0%– 33.0%222023DS1,3100.9%– 11.7%2411,1270.9%– 21.6%232324Volvo1,1600.8%– 18.5%267,6880.6%– 44.2%252125BYD1,0400.7%+ 239.9%178,8200.7%+ 260.9%243026Mazda8880.6%+ 0.6%275,4410.5%– 4.4%272727Jeep8150.6%– 3.6%257,4640.6%– 14.0%262528Alfa Romeo4900.3%+ 47.6%284,7050.4%+ 54.0%283129Honda4500.3%+ 94.0%303,4990.3%+ 12.9%313230Lexus4390.3%– 31.4%294,4070.4%– 7.3%292831Leapmotor4310.3%#######322,2570.2%+ 1147.0%334132Alpine3840.3%+ 195.4%313,8370.3%+ 93.4%303433Porsche2720.2%– 26.7%342,6110.2%– 33.0%322934Xpeng1830.1%+ 731.8%332,1190.2%+ 2178.5%343935Skyworth1100.1%new –1120.0%new436636Lancia610.0%+ 1425.0%385710.0%+ 514.0%384537Polestar550.0%+ 5400.0%51830.0%+ 4050.0%466838Smart520.0%– 70.8%356500.1%– 55.4%373539Mitsubishi470.0%– 17.5%361,5660.1%– 33.1%353340Land Rover410.0%– 91.5%371820.0%– 96.6%422641Abarth350.0%– 69.8%414560.0%– 61.8%393642Ferrari300.0%+ 7.1%422390.0%+ 0.8%404043Lynk & Co210.0%+ 250.0%396610.1%+ 34.1%363744Lamborghini120.0%– 14.3%43990.0%+ 10.0%444645Lotus100.0%– 58.3%50650.0%– 58.3%494246Bentley90.0%+ 800.0%53370.0%+ 37.0%515447Maserati70.0%+ 16.7%44800.0%+ 25.0%474848Aston Martin70.0%– 12.5%40710.0%+ 86.8%485149VinFast50.0%– 50.0% –110.0%– 85.5%574950Caterham40.0%– 55.6%48570.0%– 49.1%504351Secma30.0%+ 200.0% –190.0%– 13.6%555652Minimoke10.0%n/a49250.0%– 41.9%525553McLaren10.0%– 90.0%46180.0%– 18.2%565754Devalliet10.0%n/a5290.0%+ 12.5%596155DFSK/Seres10.0%+ 0.0%5480.0%– 72.4%6058
France September 2025 – models:
PosModelSep-25%/24Aug2025%/24PosFY241Renault Clio V8,6276.1%+ 0.9%175,5376.4%+ 12.5%112Peugeot 2086,7854.8%– 6.5%354,5054.6%– 20.0%223Dacia Sandero5,1003.6%+ 8.1%249,2694.2%– 13.5%334Citroen C3 IV4,9003.5%+ 35.1%541,9433.5%+ 735.2%4215Tesla Model Y4,8443.5%+ 5.5%2015,6661.3%– 19.3%15106Peugeot 20083,4572.5%– 0.6%441,0293.5%+ 7.2%547Peugeot 3008 III3,4142.4%– 1.8%631,0282.6%+ 133.9%6148Renault Captur3,2452.3%– 14.7%1028,5942.4%– 20.7%859Dacia Duster III3,1682.3%+ 2.1%830,0762.5%+ 168.8%71310Peugeot 3083,0852.2%+ 10.3%1123,1762.0%– 18.9%12711Toyota Yaris2,7201.9%+ 5.1%723,3612.0%– 5.7%11812Renault 52,5371.8%+ 130.4%1321,7341.8%+ 1720.3%135113Renault Symbioz2,4301.7%+ 136.6%1723,6712.0%+ 1235.8%106814Toyota Yaris Cross2,1991.6%– 24.3%924,3492.1%+ 1.2%9915VW Polo2,0331.4%– 38.4%1616,1901.4%– 9.1%141216Dacia Bigster2,0191.4%new1511,2020.9%new25 –17Citroen C3 Aircross II (est)1,9211.4%new1810,3800.9%new2932218Mini Hatch1,5141.1%+ 16.5%2510,9190.9%+ 171.3%267219MG ZS1,4751.1%+ 205.4%438,5610.7%+ 470.7%409820Renault Austral1,4661.0%– 28.1%3014,5841.2%– 27.0%161121Ford Puma1,4271.0%– 4.4%2312,3121.0%– 21.7%201822Renault Scenic V1,4221.0%+ 12.5%4110,8500.9%+ 116.2%275423Citroen C5 Aircross1,4101.0%+ 46.7%1214,5331.2%+ 31.5%173224Peugeot 5008 III1,3581.0%+ 62.6%2213,4991.1%+ 756.0%189925Toyota C-HR II1,2520.9%+ 9.1%2610,6310.9%– 4.1%282826VW Tiguan III1,2460.9%– 17.5%2811,2420.9%+ 70.2%243827Mercedes GLA1,1840.8%+ 28.1%427,7220.7%+ 1.9%424828MG 31,1020.8%+ 26.4%476,6990.6%+ 111.8%455629Nissan Qashqai1,0880.8%+ 15.6%519,0300.8%– 14.1%353430VW T-Roc1,0620.8%– 19.7%2411,5531.0%– 12.4%232431Suzuki Swift1,0460.7%+ 5.2%449,5040.8%+ 19.5%324332Dacia Jogger1,0430.7%– 27.8%2711,7131.0%– 31.7%211533Opel Corsa1,0330.7%– 33.3%1912,5051.1%– 29.6%191634VW T-Cross1,0150.7%+ 6.2%369,8300.8%– 1.9%313535Ford Kuga1,0080.7%– 1.5%379,0820.8%+ 11.6%334136BMW Série 11,0060.7%+ 43.9%338,9940.8%+ 25.7%364737Skoda Fabia1,0050.7%+ 5.6%348,7330.7%+ 21.0%394938Hyundai Tucson9840.7%– 19.3%1410,3040.9%– 11.0%302639VW Golf9790.7%+ 9.3%498,8090.7%– 24.5%382940Toyota Aygo X9750.7%– 12.7%298,9010.8%– 17.4%373341Skoda Elroq9540.7%new464,8130.4%new67 –42Renault 49270.7%new572,7810.2%new91 –43Mini Countryman8440.6%– 7.3%615,2750.4%+ 10.8%627644Mercedes Classe A8350.6%+ 38.5%506,2500.5%+ 18.1%517045Dacia Spring8240.6%+ 144.5%395,8420.5%+ 73.5%578746Skoda Octavia 8230.6%– 5.8%546,3550.5%+ 12.0%485847Hyundai Kona8210.6%– 4.1%219,0680.8%+ 3.2%343748VW ID.37940.6%+ 31.9%716,0000.5%+ 16.4%547149Opel Frontera7900.6%new673,3420.3%new79 –50Citroen C47650.5%– 44.2%3211,5871.0%– 19.0%2223
Source: AAA Data, PFA

More Stories
2027 Chevrolet Corvette Grand Sport X Could Be the Real Sweet Spot in the Lineup
Back on March 13, 2001, Paul Pierce lit up the Lakers at Staples Center with 42 points on 13-of-19 shooting....
2026 Chevrolet Silverado EV Trail Boss Review & Test Drive
The electric vehicle (EV) market has leveled out for many reasons as of late, but such an environment hasn’t stopped...
Netherlands March 2026: Tesla manages 1-2, Kia EV5 in Top 10
The Kia EV5 ranks #8 for its 5th month in market. The Dutch new car market stabilises after two horrendous...
Italy March 2026: Leapmotor T03 on podium
The Leapmotor T03 becomes the first Chinese model to enter the Italian podium. New car sales in Italy are up...
Spain March 2026: Toyota, Hyundai shoot up, BYD breaks records, highest monthly volume since June 2019
Toyota sales are up 67.5% year-on-year in February. It’s an outstanding month for new car sales in Spain with March...
Why the Maserati Mistral is the Ultimate 1960s Italian Masterpiece
As the 1960s dawned, Maserati was riding high on the acclaim of the 3500 GT and Sebring. However, it was...