
Greece July 2025: Toyota Yaris Cross back in charge in solid market (+11.5%)
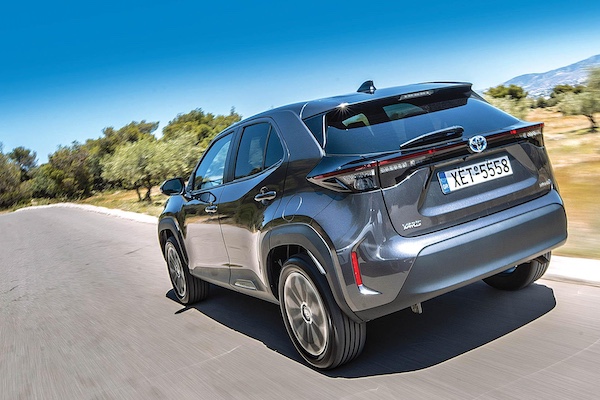
The Toyota Yaris Cross is the #1 vehicle in Greece in July. Picture Power Automotive Magazine.
New car sales in Greece are up by a solid 11.5% year-on-year in July to 13,606 units, leading to a year-to-date volume up 1.7% to 91,768. Toyota (-6%) can’t take advantage of the market growth but still manages to stay atop the brands charts with 15.9% share. Hyundai (+47.6%) is up two spots on June to #2 with 9.8% share vs. 7.3% so far this year, while Suzuki (+8.6%) stays in third place. Peugeot (-13.8%) is down two ranks to #4 just as Opel (+38.2%) rounds out the Top 5 as it also does YTD. Dacia (+250.8%) surges to 6th place, with Renault (+105.5%) and Volkswagen (+72.8%) also posting brilliant gains. Citroen (-54.9%) freefalls to #16 and Tesla drops -58.3% to #29.
In the models aisle, the Toyota Yaris Cross (+29.2%) is back up 9 spots on June to reclaim the pole position it held over the Full Year 2024. This is only the 2nd time the Yaris Cross manages to rank #1 this year after also reaching this spot last May. However the Peugeot 2008 (+29.9%) keeps a significant gap above the Yaris Cross to remain at #1 YTD. The Toyota Yaris (-31.4%) closes the podium ahead of the Suzuki Vitara (+49.5%) and Hyundai i20 (+115%). The Renault Clio (+200%) is up 9 ranks on last month to #6, wit the Kia Picanto (+44.1%), Suzuki Swift (+134%), Dacia Sandero (+291.7%) and Opel Mokka (+702.5%) all vastly outpacing the market in the remainder of the Top 10.
Previous month: Greece June 2025: Peugeot 208 and Citroen C3 lead the way
One year ago: Greece July 2024: Toyota Yaris back in charge in negative market
Full July 2025 Top 51 All brands and Top 258 All models below.
Greece July 2025 – brands:
PosBrandJul-25%/24Jun2025%/24PosFY241Toyota2,17015.9%– 6.0%113,81715.1%– 10.1%112Hyundai1,3279.8%+ 47.6%46,6767.3%+ 7.8%343Suzuki1,0217.5%+ 8.6%36,0446.6%– 18.7%424Peugeot9316.8%– 13.8%28,0028.7%+ 8.7%235Opel6554.8%+ 38.2%85,1495.6%+ 7.0%576Dacia6354.7%+ 250.8%63,0443.3%+ 93.8%10167BMW6284.6%+ 8.3%94,5054.9%+ 20.5%668Renault5944.4%+ 105.5%122,6392.9%+ 57.5%13149Volkswagen5654.2%+ 72.8%104,1294.5%+ 11.8%9810Kia5534.1%– 6.9%74,3634.8%+ 37.9%71011Nissan4553.3%+ 4.6%232,4762.7%– 17.6%141212Audi4012.9%– 10.7%132,2522.5%– 18.3%161113MG3902.9%+ 64.6%162,9883.3%+ 44.2%111814Ford3752.8%+ 31.6%172,0962.3%+ 7.9%171715Skoda3452.5%+ 88.5%142,4432.7%– 18.4%151316Citroen3072.3%– 54.9%54,3194.7%– 30.8%8517Mercedes2662.0%– 17.1%181,9562.1%– 17.4%181518Jeep2641.9%+ 111.2%191,5161.7%+ 40.2%192119Fiat2521.9%– 38.7%112,9113.2%– 31.6%12920Mazda2461.8%+ 13.9%151,1951.3%– 5.4%222321Mini1511.1%– 7.4%221,2621.4%+ 22.5%202022BYD1371.0%+ 4.6%201,2271.3%+ 526.0%212423Volvo1260.9%– 48.6%219481.0%– 4.8%231924Alfa Romeo1100.8%+ 587.5%275380.6%+ 211.0%273225Cupra920.7%+ 384.2%268170.9%+ 27.3%242626Seat870.6%– 39.2%257540.8%– 32.2%252527Chery840.6%new391120.1%new36 –28Lexus690.5%+ 56.8%284520.5%+ 126.0%282929Tesla550.4%– 58.3%246640.7%– 41.9%262230Land Rover510.4%– 29.2%323550.4%– 13.0%292731Honda470.3%+ 2.2%352520.3%+ 8.2%323032Mitsubishi400.3%– 28.6%313050.3%– 5.6%313133DFSK240.2%+ 300.0%331910.2%+ 1369.2%354034Porsche230.2%+ 0.0%302240.2%+ 50.3%333335Jaecoo230.2%new37770.1%new40 –36Moke230.2%new50270.0%new44 –37DS210.2%– 66.1%293250.4%– 12.9%302838Lynk & Co160.1%n/a421940.2%+ 921.1%343639Omoda90.1%new43510.1%new42 –40Geely80.1%new40280.0%new43 –41Leapmotor70.1%new411020.1%new383742KGM50.0%new381110.1%new37 –43Smart50.0%+ 150.0%36680.1%+ 44.7%413544Subaru30.0%+ 0.0%34860.1%+ 230.8%393845Dongfeng30.0%new5240.0%new525246Maserati20.0%– 33.3%4990.0%– 18.2%464247Jaguar10.0%– 90.9%48210.0%– 66.1%453448Xpeng10.0%new5370.0%new48 –49Lamborghini10.0%n/a4650.0%+ 400.0%495050Lotus 10.0%– 50.0%5150.0%+ 0.0%504551NIO10.0%new –10.0%new59 –
Greece July 2025 – models:
PosModelJul-25%/24Jun2025%/24PosFY241Toyota Yaris Cross7965.9%+ 29.2%104,0844.5%– 18.3%212Peugeot 20086564.8%+ 29.9%74,4684.9%+ 23.7%133Toyota Yaris 6504.8%– 31.4%63,6514.0%– 25.8%324Suzuki Vitara5654.2%+ 49.5%92,7473.0%– 15.0%555Hyundai i205594.1%+ 115.0%192,0462.2%+ 47.3%12136Renault Clio4623.4%+ 200.0%151,7041.9%+ 51.2%14127Kia Picanto3402.5%+ 44.1%42,6502.9%+ 123.3%6208Suzuki Swift3372.5%+ 134.0%32,3152.5%+ 97.0%10199Dacia Sandero3292.4%+ 291.7%81,5671.7%+ 144.1%162110Opel Mokka3212.4%+ 702.5%231,4501.6%+ 127.6%184611Hyundai i103022.2%+ 12.7%201,5371.7%+ 50.4%172512Dacia Duster2601.9%+ 372.7%121,3431.5%+ 73.7%202913Toyota C-HR2551.9%– 20.1%142,1382.3%+ 23.2%111114Nissan Juke2411.8%+ 58.6%371,2171.3%– 14.2%221615BMW X12231.6%– 36.5%171,6691.8%– 0.8%15816Toyota Aygo X2201.6%+ 45.7%161,8252.0%+ 9.6%131417Mazda22171.6%+ 16.7%111,0831.2%– 1.7%262418MG ZS Max1941.4%new221,1941.3%new238719Nissan Qashqai1911.4%– 12.8%651,0291.1%– 25.0%281820Ford Puma1901.4%– 4.5%181,2311.3%– 8.5%211521BMW 1-Series1761.3%+ 117.3%241,4301.6%+ 35.3%193122Fiat Panda1681.2%– 32.5%52,5912.8%– 18.8%9623Audi A31581.2%+ 0.0%337140.8%– 23.2%393024Jeep Avenger1571.2%+ 227.1%271,0091.1%+ 99.4%295025Hyundai Tucson1561.1%+ 73.3%347100.8%– 13.3%404226Opel Corsa1551.1%– 39.2%132,6032.8%+ 3.0%8727Opel Frontera1551.1%new253670.4%new59 –28VW T-Roc1421.0%+ 73.2%427760.8%– 12.5%353329Peugeot 30081411.0%+ 24.8%457600.8%– 36.0%372630Toyota Corolla Cross1401.0%– 15.7%211,1341.2%+ 35.6%242231Ford Kuga1351.0%+ 181.3%604620.5%+ 97.4%516732Hyundai Kona1331.0%+ 14.7%298620.9%+ 19.2%314833VW Tiguan1311.0%+ 111.3%408360.9%+ 36.2%334734Skoda Fabia1260.9%+ 152.0%261,0621.2%– 18.4%272335VW T-Cross1170.9%+ 46.3%281,1021.2%+ 70.9%254336Peugeot 2081140.8%– 64.5%12,6202.9%+ 18.0%7937Suzuki SX41120.8%+ 21.7%367680.8%+ 9.1%364538Citroen C41110.8%+ 4.7%1022910.3%– 15.7%696639Mercedes GLA1100.8%+ 34.1%359211.0%+ 3.0%303940Citroen C31030.8%– 69.3%23,6444.0%– 13.0%4441Kia Stonic1020.7%– 38.9%448010.9%– 14.7%343542Skoda Kamiq980.7%+ 46.3%466490.7%– 21.5%424443Alfa Romeo Junior890.7%new613780.4%new5817244BMW X2830.6%+ 27.7%306550.7%+ 99.1%415245MG 3810.6%+ 62.0%478460.9%+ 1091.5%327046Fiat 600780.6%n/a1182360.3%+ 23500.0%7714447Audi Q3760.6%– 49.7%315980.7%– 29.5%444148Renault Captur760.6%+ 442.9%324950.5%+ 80.0%486149MG ZS720.5%– 51.0%637410.8%– 55.1%381750Mini690.5%+ 21.1%504320.5%+ 93.7%536051Audi Q2670.5%+ 11.7%813490.4%– 26.8%615352Mini Countryman670.5%– 36.8%536200.7%– 16.2%433653VW Taigo660.5%+ 312.5%754150.5%+ 142.7%578054Chery Tiggo 7610.4%new101890.1%new117 –55Jeep Compass610.4%+ 5.2%622920.3%– 9.6%675956BYD Seal U580.4%+ 1350.0%383110.3%+ 7675.0%6314657Kia Sportage550.4%– 52.6%594270.5%– 15.1%545558Toyota Corolla510.4%– 12.1%514600.5%– 19.3%525459Citroen C5 Aircross470.3%+ 113.6%183990.1%– 54.0%1098860Hyundai Staria470.3%new564240.5%new55 –61Citroen C3 Aircross460.3%– 78.5%412510.3%– 82.1%753262VW Golf460.3%+ 170.6%684230.5%+ 141.7%567363Hyundai Bayon450.3%– 45.1%922830.3%– 70.1%704064BMW X3430.3%+ 186.7%1051290.1%+ 65.4%9811365Cupra Formentor420.3%+ 180.0%544740.5%+ 27.8%506266Seat Ibiza390.3%– 40.9%484980.5%– 37.4%475167Audi A1380.3%+ 8.6%433360.4%+ 80.6%628168Kia Xceed380.3%– 41.5%892560.3%– 39.3%746469Mitsubishi Space Star380.3%+ 65.2%732210.2%+ 18.8%808970Tesla Model Y380.3%+ 5.6%393560.4%– 19.5%605871Hyundai i30370.3%– 43.9%855010.5%– 58.6%462772Hyundai Inster360.3%new522370.3%new76 –73Jeep Renegade360.3%+ 100.0%761690.2%– 28.7%887274Lexus LBX350.3%+ 0.0%662920.3%+ 192.0%688375Seat Leon350.3%+ 1650.0%1281270.1%+ 0.0%1019476Toyota RAV4340.2%+ 41.7%742190.2%– 9.5%817177Volvo XC60340.2%– 20.9%553090.3%+ 12.0%656578Dacia Bigster330.2%new113530.1%new149 –79Mercedes GLC320.2%– 73.1%772320.3%– 35.7%786380Volvo EX30320.2%– 79.4%493090.3%– 14.9%644981Cupra Terramar300.2%new841590.2%new9026182Skoda Scala300.2%+ 275.0%1441710.2%– 31.0%878483Audi Q4290.2%– 17.1%821270.1%– 26.2%1008284Mercedes A-Class290.2%+ 7.4%901550.2%– 36.5%927585Skoda Octavia290.2%+ 52.6%671900.2%– 34.7%837486Lexus NX280.2%+ 460.0%115910.1%+ 75.0%11513987BYD Dolphin260.2%+ 2500.0%834850.5%+ 16066.7%495788Skoda Kodiaq260.2%– 7.1%992220.2%+ 37.0%798589Volvo XC40260.2%– 18.8%931350.1%– 40.5%967790BYD Atto 3250.2%– 79.7%582770.3%+ 66.9%725691Renault Symbioz250.2%new86850.1%new119 –92Mercedes Vito, Viano240.2%+ 500.0%1171680.2%+ 36.6%8910693MG HS240.2%+ 14.3%941430.2%– 32.9%938694Chery Tiggo 8230.2%new –230.0%new191 –95Jaecoo 7230.2%new88770.1%new123 –96Moke230.2%new252270.0%new183 –97Skoda Elroq230.2%new134500.1%new153 –98BMW 2-Series200.1%+ 1900.0%1031190.1%+ 54.5%10310999Ford Explorer200.1%n/a1141000.1%+ 2400.0%108158100MG 4190.1%+ 0.0%165600.1%– 56.2%141101101Alfa Romeo Tonale180.1%+ 28.6%911400.2%– 10.8%9590102VW Transporter180.1%+ 350.0%191240.0%– 69.2%190141103Renault Arkana170.1%– 83.7%722830.3%+ 48.9%7169104Cupra Leon160.1%– 70.4%1251300.1%– 44.4%9779105Honda HR-V160.1%+ 14.3%148760.1%– 14.6%126108106Mercedes GLE160.1%+ 100.0%249470.1%+ 2.2%155125107Volvo XC90160.1%+ 128.6%124730.1%+ 25.9%132118108Audi Q5150.1%+ 200.0%170540.1%– 20.6%148121109Honda Jazz150.1%+ 25.0%130800.1%+ 21.2%121115110Mercedes C-Class150.1%+ 66.7% –260.0%– 59.4%184128111Range Rover Sport150.1%– 21.1%111960.1%– 3.0%111102112Tesla Model 3150.1%– 84.4%693000.3%– 56.3%6637113VW Polo150.1%– 59.5%572650.3%– 68.1%7338114Kia EV3140.1%new1061820.2%new85227115BMW 3-Series130.1%+ 160.0%135720.1%– 18.2%133111116BMW iX2130.1%+ 116.7%172610.1%+ 205.0%140138117Seat Arona130.1%– 40.9%971290.1%– 14.0%9997118VW Caddy130.1%+ 0.0%1081010.1%+ 50.7%107124119BMW iX1120.1%+ 20.0%1121100.1%+ 18.3%105103120BYD Sealion 7120.1%new173370.0%new168 –121Dacia Jogger120.1%– 67.6%95740.1%– 41.7%12898122DFSK 600120.1%+ 300.0%160320.0%+ 700.0%175275123Lynk & Co 01120.1%n/a –1740.2%+ 815.8%86152124Skoda Karoq120.1%+ 50.0%169450.0%– 21.1%158140125DS 7110.1%– 54.2%871820.2%+ 5.2%8493126Ford Capri110.1%new235300.0%new180259127Nissan X-Trail110.1%– 74.4%1191080.1%– 26.0%10695128Range Rover Evoque110.1%– 50.0%142940.1%– 25.4%11499129Toyota Proace City Verso110.1%– 35.3%1771560.2%– 47.5%9176130BMW i4100.1%+ 150.0%182320.0%– 36.0%174137131Hyundai Ioniq 5100.1%– 41.2%161450.0%– 33.8%157131132Land Rover Defender100.1%+ 66.7%150710.1%+ 20.3%135129133Mazda MX-5100.1%– 28.6%163300.0%– 25.0%181150134Mini Cabrio100.1%n/a711200.1%+ 79.1%102147135Opel Astra100.1%+ 900.0%1205840.6%+ 771.6%4591136Porsche Cayenne100.1%– 28.6%110970.1%+ 3.2%110107137BYD Atto 290.1%new136650.1%new138 –138Honda ZR-V90.1%– 25.0%137510.1%+ 112.5%150159139Jeep Wrangler90.1%n/a149440.0%+ 388.9%159203140Omoda 590.1%new166510.1%new151 –141Opel Grandland90.1%– 73.5%1531140.1%– 40.3%10492142Toyota bZ4X90.1%+ 80.0%129590.1%+ 436.4%143180143Volvo C40/EC4090.1%+ 50.0%157380.0%– 25.5%167133144BMW 4-Series80.1%+ 100.0%181300.0%– 11.8%179162145BMW X580.1%– 42.9%123720.1%+ 24.1%134112146DFSK E580.1%+ 300.0%109760.1%+ 985.7%125207147Geely EX580.1%new104280.0%new182 –148Mazda CX-3080.1%+ 0.0%186420.0%+ 23.5%161145149Renault 580.1%new220340.0%new172 –150Audi A570.1%n/a202240.0%+ 1100.0%188268151Audi Q670.1%new192180.0%new206253152Mazda370.1%+ 250.0%215200.0%+ 33.3%202192153Mercedes CLE70.1%– 41.7%127670.1%+ 168.0%137149154Porsche Macan70.1%+ 600.0%122750.1%+ 837.5%127151155Suzuki Ignis70.1%– 97.9%1382040.2%– 91.2%8210156DS 360.0%+ 20.0%231650.1%+ 12.1%139135157Ford Tourneo Courier60.0%+ 500.0%147370.0%+ 164.3%169178158Land Rover Discovery Sport60.0%+ 0.0%242220.0%– 12.0%197179159Leapmotor T0360.0%new176940.1%new113177160Mercedes G-Class60.0%n/a164210.0%+ 425.0%199223161Mercedes V-Class60.0%– 14.3%116590.1%+ 118.5%142174162Peugeot 500860.0%+ 100.0%121570.1%+ 235.3%146184163Volvo EX4060.0%new145550.1%new147110164VW Tayron60.0%new158230.0%new194 –165BYD Seal50.0%+ 66.7%228340.0%+ 47.8%170142166Fiat 50050.0%– 96.9%197690.1%– 93.4%13628167Honda Civic50.0%+ 150.0%185210.0%+ 23.5%198165168KGM Tivoli50.0%new96770.1%new124 –169Mercedes EQA50.0%– 61.5%151440.0%– 49.4%160105170Mini Aceman50.0%new132900.1%new116189171Nissan Primastar50.0%– 66.7%152950.1%+ 150.0%112148172Opel Zafira50.0%– 16.7%253310.0%+ 82.4%178200173Peugeot Expert Traveller50.0%+ 150.0%219250.0%+ 13.6%187194174VW ID.Buzz50.0%+ 150.0%263160.0%+ 100.0%213187175BMW 5-Series40.0%– 20.0%139400.0%+ 90.5%164175176BMW X440.0%+ 0.0%193140.0%– 54.8%215163177BMW X640.0%– 50.0%194200.0%– 44.4%200156178DFSK 50040.0%+ 300.0%126830.1%+ 4050.0%120283179DS 440.0%– 87.9%98780.1%– 45.1%12296180Ford Focus40.0%– 81.8%641420.2%+ 34.0%94100181Ford Tourneo Connect40.0%n/a210180.0%+ 5.9%208201182Lexus UX40.0%+ 0.0%140570.1%+ 103.6%145155183Lynk & Co 0240.0%new162200.0%new201 –184Peugeot 40840.0%n/a133510.1%+ 112.5%152171185Range Rover40.0%– 71.4%188320.0%– 49.2%176122186Range Rover Velar40.0%+ 100.0%258390.0%+ 30.0%166166187Smart #340.0%+ 300.0%154180.0%+ 1700.0%210235188Toyota Proace40.0%– 20.0%156730.1%– 8.8%131117189VW ID.340.0%– 42.9%79740.1%– 15.9%129104190Alfa Romeo Giulia30.0%+ 200.0%20190.0%+ 0.0%228228191BMW XM30.0%n/a195160.0%+ 33.3%211197192Cupra Born30.0%+ 50.0%159310.0%– 56.3%177119193Dongfeng Box30.0%new23040.0%new259 –194Kia Niro30.0%– 50.0%199330.0%– 58.8%173130195Mazda CX-6030.0%+ 200.0%247130.0%– 13.3%216190196Mercedes E-Class30.0%– 72.7%187420.0%– 31.1%162127197Mercedes GLB30.0%– 57.1%70850.1%– 68.3%11878198Mercedes S-Class30.0%+ 50.0%217110.0%+ 266.7%222255199Nissan Leaf30.0%+ 200.0% –70.0%+ 16.7%245241200Porsche 91130.0%n/a167200.0%+ 150.0%203219201Renault Trafic30.0%– 76.9%143180.0%– 60.9%209164202BMW iX20.0%n/a22450.0%– 37.5%255213203BYD Dolphin Surf20.0%new227180.0%new207 –204Ford Tourneo Custom20.0%– 66.7%198390.0%– 51.9%165123205Honda CR-V20.0%– 66.7% –150.0%– 55.9%214167206Hyundai Santa Fe20.0%n/a174220.0%+ 340.0%196242207Lexus RX20.0%n/a21480.0%– 42.9%236199208Maserati Grecale20.0%+ 100.0%24680.0%– 11.1%237210209Mercedes Sprinter20.0%+ 100.0%25070.0%– 12.5%244221210Nissan Ariya20.0%– 60.0% –100.0%– 23.1%224205211Peugeot 30820.0%– 98.3%255100.0%– 95.2%22568212Peugeot Rifter20.0%– 50.0% –30.0%– 57.1%275237213Porsche Taycan20.0%+ 0.0%257120.0%– 25.0%219191214Subaru Forester20.0%+ 0.0%80730.1%+ 305.6%130195215Tesla Model X20.0%n/a –60.0%– 25.0%254218216Volvo EX9020.0%new178200.0%new204260217VW ID.420.0%– 50.0%100590.1%+ 22.9%144134218Audi A410.0%– 50.0% –10.0%– 94.7%299193219Audi A610.0%n/a18060.0%+ 200.0%246271220Audi Q710.0%+ 0.0% –70.0%+ 75.0%239244221Audi Q810.0%n/a171120.0%– 69.2%218170222BMW i510.0%n/a22370.0%+ 0.0%241246223BMW X710.0%– 75.0%22660.0%– 45.5%248215224Cupra Tavascan10.0%new229230.0%new192226225Dacia Logan10.0%n/a –10.0%n/a307 –226Fiat Tipo10.0%n/a20840.0%+ 100.0%260286227Ford Fiesta10.0%n/a –10.0%– 98.8%312136228Ford Mustang10.0%+ 0.0%20990.0%+ 800.0%229289229Ford Mustang Mach-E10.0%– 87.5%184240.0%– 54.7%189132230Jaguar E-Pace10.0%+ 0.0% –30.0%– 80.0%268206231Jeep Grand Cherokee10.0%+ 0.0% –30.0%– 50.0%269240232Kia Ceed10.0%+ 0.0% –10.0%+ 0.0%316313233Lamborghini Urus10.0%n/a21330.0%n/a271 –234Land Rover Discovery10.0%– 66.7% –10.0%– 83.3%319249235Leapmotor C1010.0%new17580.0%new235233236Lotus Emira10.0%– 50.0%24530.0%– 40.0%272258237Mazda CX-8010.0%new –60.0%new252305238Mercedes Citan10.0%– 87.5%24890.0%– 71.9%232181239Mercedes CLA10.0%– 80.0%141250.0%– 60.3%185126240Mercedes EQE SUV10.0%new –20.0%new291217241Mercedes EQS SUV10.0%new –10.0%new326 –242Mercedes GLS10.0%n/a –30.0%+ 200.0%273298244Mitsubishi ASX10.0%– 90.9% –340.0%– 10.5%171157245Mitsubishi Colt10.0%– 95.5%200490.1%– 50.5%154120246NIO EL610.0%new –10.0%new329 –247Nissan Interstar10.0%n/a –20.0%– 77.8%293230248Nissan Townstar10.0%new21860.0%new253 –249Peugeot Boxer10.0%– 90.9% –40.0%– 93.4%261143250Porsche Panamera10.0%– 80.0%168190.0%+ 90.0%205204251Renault Austral10.0%+ 0.0% –100.0%– 60.0%226182252Renault Master10.0%+ 0.0% –30.0%+ 50.0%276285253Renault Megane E-Tech10.0%n/a –30.0%+ 200.0%277231254Skoda Superb10.0%n/a190120.0%– 7.7%220211255Smart #110.0%new107460.1%new156232256Subaru Solterra10.0%new –10.0%new338330257Volvo V6010.0%– 50.0%22190.0%– 55.0%234183258Xpeng P710.0%new –30.0%new280 –
Source: SEAA

More Stories
A Simple Guide to Car Finance for People with Poor Credit
Buying a car is an important step towards independence and convenience, but it can feel out of reach if you...
Ariel launches new 525bhp motorsport-spec ‘Atom 4RR’ and it’s a belter
• Track‑focused yet road‑legal, the Atom 4RR is Ariel’s most extreme performance machine ever • Bespoke, hand‑built, motorsport‑spec 525bhp / 550Nm Honda engine revving to 8,200rpm • Quickest Atom ever: 2.4 seconds...
GM Highlights New Tech and Driver Awareness Efforts to Tackle Distracted Driving
General Motors is using Distracted Driving Awareness Month to put a spotlight on something the industry too often learns the...
Volkswagen ID.4 Production in Chattanooga Ends as Atlas Demand Takes Priority
Volkswagen is pressing pause on the ID.4 in the United States, but this is not being framed as a funeral...
Kia’s Future Midsize Truck Could Be the Brand’s Biggest North American Play Yet
Kia has officially confirmed it will launch a body-on-frame pickup for North America by 2030, and that alone makes this...
Volkswagen Isn’t Giving Up on Sedans or Hot Hatches and That’s Good News for Enthusiasts
In an era when nearly every mainstream brand is rushing harder toward SUVs, Volkswagen is making it clear that it...