
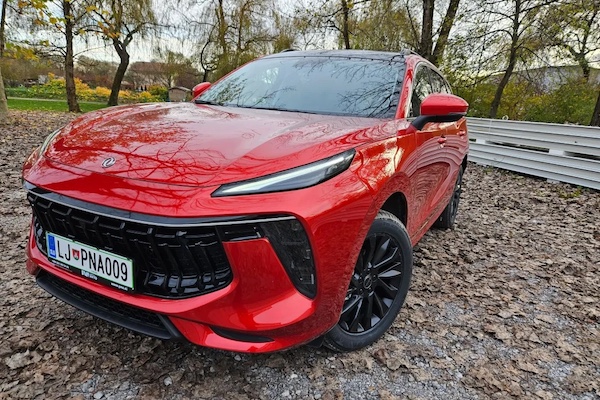
Slovenia July 2025: Forthing T5 Evo on podium
The Forthing T5 Evo is up to #3 in Slovenia in July.
New car sales in Slovenia soar 12.8% year-on-year in July to 5,109 units. This leads to YTD tally up 7.2% to 35,243. Volkswagen (+2.1%) reclaims the top spot it holds year-to-date off Renault (-10.6%), despite trailing the market. Note Renault endures the only YoY loss in the Top 8. Skoda (+18.4%) threepeats at #3 but still ranks #2 year-to-date. Ford (+66.7%), Hyundai (+55.4%) and Toyota (+40.1%) all lodge fantastic upticks below. Further down, Chinese fare Forthing (+431.4%) shoots up 12 spots on last month to a record #11 with 3.3% share thanks to one model as we’ll see further down. Tesla (+290.9%) and MG (+141.4%) also shine.
Model-wise, the Renault Clio (+20.6%) easily stays in the lead above the Skoda Octavia (+57.6%) back up to #2 both for the month and YTD. The performer of the month is the Forthing T5 Evo (+428.6%) up 30 ranks on June to crack the Slovenian Top 10 for the first time, directly landing at #3. The Renault Captur (-23.9%) suffers but still ranks #4 while the Peugeot 2008 (+46.8%) rounds out the Top 5. The Dacia Sandero (+186.1%) surges 52 spots to #, with the Citroen C3 (+67.8%), VW Golf (+39%) and Skoda Kamiq (+21.8%) all beating the market in the remainder of the Top 10.
Previous month: Slovenia June 2025: Renault Clio and Captur now in YTD lead
One year ago: Slovenia July 2024: Renault Clio clear leader, now #1 YTD
Full July 2025 Top 44 All brands and Top 253 All models below.
Slovenia July 2025 – brands:
PosBrandJul-25%/24Jun2025%/24PosFY241Volkswagen79215.5%+ 2.1%25,38315.3%+ 11.2%112Renault53910.6%– 10.6%13,72610.6%+ 2.4%323Skoda50910.0%+ 18.4%33,97511.3%+ 24.1%234Hyundai3456.8%+ 55.4%82,0595.8%+ 14.8%465Toyota2905.7%+ 40.1%51,9505.5%– 7.7%546Kia2504.9%+ 10.1%91,5384.4%+ 4.2%887Ford2404.7%+ 66.7%41,6904.8%+ 86.5%7118Dacia2314.5%+ 7.9%111,1403.2%– 11.6%1179Peugeot2124.1%– 6.6%61,7144.9%– 7.4%6510Citroen1803.5%+ 15.4%71,2753.6%– 2.7%91011Forthing1703.3%+ 431.3%234731.3%+ 616.7%193012Audi1593.1%– 23.9%101,2193.5%– 0.8%10913Opel1583.1%+ 1.9%159162.6%– 8.4%141314Mercedes1222.4%+ 29.8%129492.7%+ 28.6%131515BMW1202.3%– 12.4%149762.8%– 3.8%121216Nissan921.8%+ 48.4%186261.8%+ 15.5%151717MG701.4%+ 141.4%174031.1%– 8.0%212118Mazda581.1%+ 13.7%194891.4%+ 3.8%182019Seat571.1%– 12.3%203921.1%– 38.2%221920Geely491.0%– 3.9%222630.7%+ 19.0%242321Tesla430.8%+ 290.9%135051.4%– 8.3%171822Cupra410.8%+ 17.1%214641.3%+ 55.2%202223Jeep390.8%+ 69.6%262650.8%+ 15.7%232524Fiat350.7%– 73.9%242440.7%– 66.6%251425Dongfeng320.6%new251770.5%new283726Suzuki310.6%– 52.3%165891.7%– 27.0%161627KG Mobility/Ssangyong270.5%+ 440.0%272100.6%+ 100.0%272928Porsche240.5%+ 71.4%301630.5%– 6.3%292629Leapmotor230.5%new –230.1%new40 –30Volvo170.3%– 5.6%282160.6%– 11.8%262431Lynk & Co160.3%n/a37300.1%+ 400.0%393832Lexus130.3%+ 8.3%321130.3%+ 61.4%303133Honda130.3%– 45.8%351080.3%– 23.4%312734Alfa Romeo130.3%+ 44.4%291050.3%+ 43.8%323235Subaru120.2%+ 200.0%31650.2%+ 242.1%353636Mini90.2%+ 12.5%34610.2%+ 27.1%363437Mitsubishi80.2%– 61.9%33950.3%– 30.7%332838Man80.2%+ 700.0%36400.1%+ 900.0%373939Land Rover60.1%+ 0.0%38680.2%+ 19.3%343340DS30.1%+ 0.0%39360.1%– 35.7%383541Alpine10.0%n/a4080.0%+ 166.7%414242Aston Martin10.0%n/a4130.0%n/a444643Lamborghini10.0%+ 0.0%4220.0%+ 0.0%494344BYD10.0%n/a –20.0%+ 100.0%5049 –Others491.0%+ 16.7% –4761.4%+ 42.5% – –
Slovenia July 2025 – models:
PosModelJul-25%/24Jun2025%/23PosFY241Renault Clio2995.9%+ 20.6%11,5194.3%+ 17.0%112Skoda Octavia1863.6%+ 57.6%31,2703.6%+ 19.9%223Forthing T5 Evo1482.9%+ 428.6%334081.2%+ 615.8%22854Renault Captur1212.4%– 23.9%21,2293.5%+ 30.5%335Peugeot 20081162.3%+ 46.8%126381.8%– 22.3%1056Hyundai Tucson1132.2%+ 8.7%246882.0%+ 21.8%8107VW Golf1072.1%+ 39.0%137332.1%+ 69.3%6118Skoda Kamiq1062.1%+ 21.8%118912.5%+ 43.9%479Dacia Sandero1032.0%+ 186.1%612850.8%– 17.9%341710Citroen C3991.9%+ 67.8%86811.9%+ 15.0%91911VW T-Roc871.7%+ 22.5%75941.7%+ 1.0%121412VW Tiguan841.6%– 31.7%46912.0%+ 3.3%7913VW T-Cross821.6%– 24.8%105781.6%– 11.6%13814Dacia Duster801.6%– 50.0%96001.7%– 21.8%11615Toyota Yaris Cross801.6%+ 25.0%204951.4%– 29.7%151216Kia Sportage771.5%+ 42.6%254331.2%– 6.7%192017Nissan Qashqai761.5%+ 85.4%154641.3%+ 19.0%161818Toyota Corolla721.4%+ 50.0%174291.2%– 17.3%201619Skoda Kodiaq691.4%– 31.0%57992.3%+ 12.5%5420Opel Frontera691.4%new991030.3%new89 –21Hyundai Kona651.3%+ 116.7%393240.9%+ 26.6%294522VW Touran621.2%+ 24.0%433060.9%+ 53.0%313023Ford Tourneo Custom611.2%+ 771.4%144341.2%+ 611.5%188824Ford Kuga581.1%+ 31.8%223491.0%– 2.2%262525VW Multivan571.1%– 9.5%274601.3%+ 25.3%172326VW Taigo541.1%– 38.6%384291.2%– 22.8%211527VW ID.4491.0%+ 206.3%862220.6%+ 252.4%4111128Kia Xceed480.9%+ 50.0%1051830.5%– 5.7%545129Kia Stonic470.9%+ 6.8%443501.0%+ 5.4%253130VW Passat470.9%+ 62.1%183531.0%+ 16.5%243131Toyota C-HR460.9%+ 170.6%632800.8%+ 26.7%354030Peugeot 208450.9%– 42.3%165621.6%+ 4.5%141331Kia Ceed410.8%– 34.9%233621.0%+ 58.1%233332Skoda Karoq400.8%– 14.9%293130.9%+ 1.0%302633Hyundai i10400.8%+ 700.0%1192510.7%+ 83.2%367334Mercedes GLC390.8%+ 129.4%662010.6%+ 120.9%478435Opel Mokka390.8%+ 143.8%522220.6%– 9.0%404636Mazda CX-30370.7%+ 68.2%193160.9%+ 54.1%304337Renault Symbioz370.7%+ 3600.0%841370.4%+ 13600.0%7616038Hyundai i20360.7%+ 111.8%562460.7%– 23.1%384439Dacia Bigster350.7%new511070.3%new86 –40Ford Tourneo Courier340.7%– 35.8%313411.0%+ 135.2%274941Toyota Proace340.7%+ 88.9%402180.6%+ 80.2%426442VW Tayron340.7%new301920.5%new51 –43Audi Q3330.6%– 29.8%422980.8%– 10.0%322944Seat Leon320.6%+ 60.0%621970.6%+ 5.9%495845Dongfeng Box320.6%new371730.5%new5720346Peugeot 3008310.6%+ 40.9%581950.6%+ 99.0%507547MG ZS EV290.6%+ 38.1%471770.5%– 36.6%553748Citroen C3 Aircross280.5%– 12.5%80980.3%– 66.8%913849Jeep Avenger280.5%+ 115.4%572080.6%+ 29.2%445450Ford Transit Custom280.5%+ 300.0%762080.6%+ 1790.9%4310851VW Polo270.5%– 57.8%212370.7%– 31.9%392752Skoda Fabia270.5%+ 17.4%812040.6%+ 35.1%455553Skoda Elroq270.5%new411400.4%new75 –54Renault Austral260.5%– 46.9%303401.0%– 2.3%282255Hyundai Bayon260.5%– 35.0%881870.5%– 35.3%533956Audi Q5260.5%– 21.2%701440.4%+ 21.0%717057VW ID.7260.5%+ 136.4%1091160.3%+ 38.1%849158Opel Corsa240.5%– 71.4%462480.7%– 19.0%373560Ford Puma230.5%+ 76.9%491430.4%– 7.7%736261Renault 5230.5%new551180.3%new8034362Toyota Yaris220.4%– 56.0%311710.5%– 43.6%602863Citroen C4220.4%+ 10.0%731590.5%– 13.1%656564VW Caddy220.4%+ 22.2%851450.4%+ 28.3%707465BMW X3220.4%+ 57.1%54960.3%+ 11.6%9310466Tesla Model 3220.4%+ 340.0%281900.5%– 32.1%523467Forthing U-Tour220.4%+ 450.0%145640.2%+ 1500.0%12119568Fiat 600220.4%new1041020.3%new9021569Suzuki Vitara210.4%– 40.0%262910.8%– 22.2%333070Skoda Scala210.4%– 34.4%531630.5%+ 7.2%646371Skoda Superb210.4%+ 5.0%481460.4%– 5.2%696073Tesla Model Y210.4%+ 320.0%63150.9%+ 19.8%314174Geely Coolray200.4%– 53.5%741500.4%+ 37.6%676775Hyundai i30200.4%+ 0.0%1131650.5%+ 0.6%615776Kia EV3190.4%new125930.3%new9533977BMW X1180.4%– 10.0%1001630.5%+ 69.8%627778Mercedes GLA180.4%+ 157.1%67970.3%+ 56.5%9210379Hyundai Inster180.4%new79780.2%new106 –80Citroen C5 Aircross160.3%+ 0.0%641160.3%– 6.5%838381Mercedes V-Class160.3%+ 45.5%106810.2%+ 0.0%10510082Geely Starray160.3%new117850.2%new10018183Lynk & Co 02160.3%new –180.1%new199 –84VW Transporter150.3%– 62.5%36960.3%– 59.3%945685Toyota bZ4X150.3%+ 1400.0%68710.2%+ 446.2%11419686Audi Q6 e-tron150.3%new128580.2%new12726987Audi A3140.3%– 30.0%751510.4%+ 37.3%667688Toyota RAV4140.3%+ 75.0%911770.5%+ 0.6%565289Cupra Terramar140.3%new1441060.3%new8724490Ford Focus130.3%+ 44.4%341230.3%+ 11.8%788291Lexus LE130.3%+ 62.5%110900.3%+ 150.0%9812192VW ID.3130.3%+ 62.5%126710.2%+ 77.5%1158993MG HS130.3%+ 225.0%159670.2%– 23.0%1208794Leapmotor T03130.3%new –130.0%new223 –95Citroen Berlingo120.2%– 55.6%1021710.5%+ 175.8%586996Cupra Born120.2%– 36.8%652030.6%+ 30.1%465097Dacia Jogger120.2%– 25.0%831190.3%– 11.2%795398Mercedes C-Class120.2%+ 33.3%137370.1%– 19.6%15713999Audi A5120.2%+ 100.0%1031170.3%+ 408.7%81155100Skoda Enyaq120.2%+ 300.0%116490.1%+ 0.0%139131101Hyundai Ioniq 5120.2%+ 500.0%138670.2%+ 81.1%119138102Kia Picanto110.2%– 59.3%118580.2%– 68.6%12861103Renault Megane Conquest110.2%– 50.0%821430.4%– 3.4%7468104Seat Ateca110.2%– 15.4%136530.2%– 56.9%13280105Geely Cityray110.2%new146170.0%new203 –106KG Mobility Torres110.2%n/a92790.2%+ 1480.0%110173107Audi Q2100.2%– 79.6%971150.3%– 59.8%8536108Audi Q8100.2%+ 0.0%115610.2%+ 0.0%124118109Audi Q4100.2%+ 42.9%107480.1%– 14.3%140125110Audi A6100.2%+ 100.0%98670.2%+ 76.3%118147111KG Mobility Korando100.2%+ 150.0%87820.2%– 15.5%10296112Cupra Tavascan100.2%new111890.3%new99180113Ford Explorer100.2%n/a135300.1%+ 1400.0%169220114Hyundai Santa Fe100.2%n/a173300.1%+ 400.0%171172115Leapmotor C10100.2%new –100.0%new234 –116VW Caravelle100.2%n/a157230.1%n/a187 –117BMW 5 Series90.2%– 25.0%1011160.3%+ 33.3%82102118BMW 2 Series90.2%+ 12.5%77820.2%– 14.6%10192119Nissan Juke90.2%+ 12.5%127600.2%+ 30.4%126127120MG 490.2%+ 125.0%132680.2%– 1.4%11790121Opel Grandland X90.2%+ 125.0%351300.4%+ 441.7%77164122Alfa Romeo Junior90.2%new95750.2%new109 –123Peugeot 30880.2%– 77.8%691630.5%– 37.1%6342124Seat Arona80.2%– 57.9%90780.2%– 44.7%10771125BMW X580.2%– 33.3%160510.1%– 34.6%135106126Ford Tourneo Connect80.2%+ 14.3%151330.1%– 8.3%164132127Opel Combo80.2%+ 33.3%143520.1%+ 188.9%134162128Porsche 91180.2%+ 166.7%133540.2%+ 58.8%131156129Man TGE80.2%+ 700.0%129400.1%+ 900.0%149233130Subaru Forester80.2%+ 700.0%93420.1%+ 1300.0%148247131VW California80.2%+ 700.0%152400.1%+ 233.3%151221132MG 580.2%n/a –90.0%+ 350.0%242276133MG ZS80.2%n/a108200.1%n/a194 –134Renault Trafic70.1%– 92.5%961060.3%– 80.9%8821135Jeep Compass70.1%– 12.5%224230.1%– 46.5%185142136Mercedes B-Class70.1%+ 0.0%941470.4%+ 126.2%68114137Mercedes AMG/GT70.1%+ 75.0%195480.1%+ 60.0%142159138Opel Astra70.1%+ 133.3%89920.3%– 48.9%9666139Mazda CX-6070.1%+ 250.0%154250.1%– 13.8%180152140Porsche Macan70.1%+ 250.0%161390.1%+ 18.2%155154141Peugeot 500870.1%+ 600.0%141750.2%+ 837.5%112149142Fiat Grande Panda70.1%new –70.0%new251 –143BMW iX160.1%– 50.0%139680.2%+ 7.9%133120144Volvo XC4060.1%– 45.5%114780.2%– 29.1%10881145Mazda CX-560.1%– 40.0%174350.1%– 46.2%160123146BMW 3 Series60.1%– 33.3%140270.1%– 51.8%177122147Suzuki Swift60.1%– 25.0%71910.3%+ 21.3%9793148BMW X660.1%– 14.3%221320.1%– 27.3%166143149Nissan X-Trail 60.1%+ 0.0%147750.2%+ 21.0%111119150Mazda360.1%+ 20.0%201500.1%– 3.8%138124151Volvo XC6060.1%+ 50.0%164510.1%– 23.9%136110152Seat Ibiza60.1%+ 100.0%150620.2%– 23.5%123112153Mini Cooper60.1%+ 200.0%149290.1%+ 0.0%172150154Renault Scenic60.1%+ 500.0%124230.1%– 39.5%186166155KG Mobility Tivoli60.1%new213360.1%new158225156Cupra Formentor50.1%– 50.0%120480.1%– 53.8%14186157BMW i450.1%– 28.6%177420.1%– 39.1%147115158VW Touareg50.1%– 16.7%158720.2%– 17.2%113107159Honda HR-V50.1%+ 25.0%230300.1%+ 87.5%170165160Audi Q750.1%+ 66.7%123500.1%+ 354.5%137182161Porsche Cayenne50.1%+ 66.7%131460.1%– 34.3%144116162Range Rover50.1%+ 66.7%175290.1%– 23.7%173153163Land Rover Defender50.1%+ 400.0%229340.1%+ 277.8%163190164BMW X440.1%– 60.0%193280.1%– 65.4%174109165Hyundai Ioniq 640.1%+ 0.0%227160.0%– 15.8%208183166Mercedes CLA40.1%+ 0.0%50820.2%– 6.8%104105167Mercedes Vito40.1%+ 33.3% –60.0%– 14.3%257241168BMW M240.1%+ 100.0%196160.0%– 23.8%206194169Fiat Ducato40.1%+ 300.0%206100.0%– 16.7%233230170BMW IX40.1%n/a225150.0%+ 50.0%179216171Mitsubishi Outlander40.1%n/a –140.0%n/a217 –172Toyota Aygo X40.1%n/a180310.1%+ 93.8%168189173Suzuki SX4 S-Cross30.1%– 80.0%321990.6%– 18.8%4848174Renault Rafale30.1%– 70.0%142380.1%+ 216.7%156191175Mercedes E-Class30.1%– 62.5%176350.1%– 16.7%161134176Alfa Romeo Stelvio30.1%– 50.0%181170.0%– 22.7%201179177Peugeot 40830.1%– 50.0% –330.1%– 63.7%165113178Kia Sorento30.1%– 25.0%202150.0%– 48.3%213168179Renault Espace30.1%– 25.0%204280.1%– 28.2%176145180BMW M330.1%+ 0.0%200210.1%– 34.4%190157181BMW XM30.1%+ 0.0%212130.0%+ 44.4%220224182Honda CR-V30.1%+ 0.0%167390.1%– 17.0%153135183Mercedes A-Class30.1%+ 0.0%134820.2%+ 121.6%103133184DS 730.1%+ 50.0%222320.1%– 8.6%167146185Honda Civic30.1%+ 50.0%198240.1%– 33.3%182148186Subaru Outback30.1%+ 50.0%237120.0%+ 71.4%227254187Volvo EX3030.1%+ 50.0%170200.1%+ 11.1%195177188Audi A130.1%+ 200.0%162230.1%– 23.3%183167189BMW 4 Series30.1%+ 200.0% –130.0%– 43.5%219184190VW Crafter30.1%+ 200.0%223200.1%+ 81.8%196223191Audi RS330.1%n/a185140.0%+ 600.0%216272192Ford Capri30.1%new187130.0%new221 –193MG 330.1%new45600.2%new125207194Mitsubishi Space Star20.0%– 87.5%148450.1%– 36.6%14695195Opel Vivaro20.0%– 60.0% –50.0%– 54.5%263228196Porsche Panamera20.0%– 50.0% –100.0%+ 42.9%237218197Renault Megane20.0%– 50.0%217210.1%– 81.3%19294198Audi S320.0%– 33.3%231110.0%+ 120.0%228252199BMW i520.0%– 33.3%169230.1%+ 9.5%184171200Mercedes GLE20.0%– 33.3%226200.1%– 33.3%193161201Mitsubishi ASX20.0%– 33.3%122360.1%– 5.3%159144202BMW 1 Series20.0%+ 0.0%121690.2%+ 165.4%116174203BMW X220.0%+ 0.0%178270.1%+ 58.8%178188204Audi SQ520.0%+ 100.0% –20.0%+ 100.0%285320205BMW iX220.0%+ 100.0%210130.0%+ 116.7%229236206Jeep Renegade20.0%+ 100.0%199220.1%– 8.3%188178207Kia Proceed20.0%+ 100.0%165110.0%– 42.1%231187208Mercedes Sprinter20.0%+ 100.0%205100.0%+ 0.0%236229209Porsche 718/Boxster20.0%+ 100.0%22040.0%– 75.0%271200210Citroen Jumpy20.0%n/a112390.1%+ 3800.0%152317211Ford Transit20.0%n/a –30.0%– 62.5%276258212Geely EX520.0%new130110.0%new230 –213Honda Jazz20.0%n/a183150.0%+ 114.3%212213214Kia Niro20.0%n/a209170.0%+ 325.0%204240215Mini Aceman20.0%new184150.0%new215290216Toyota Land Cruiser20.0%n/a155570.2%+ 1325.0%129176217Fiat 500 10.0%– 99.1% –150.0%– 95.5%21124218Audi A410.0%– 94.4% –170.0%– 86.4%20278219Fiat Panda10.0%– 93.3%60550.2%– 81.5%13032220Mazda210.0%– 91.7%218400.1%– 65.5%15079221Mini Countryman10.0%– 83.3%171170.0%– 29.2%205175222Nissan Townstar10.0%– 83.3%197250.1%– 26.5%181151223Mercedes GLB10.0%– 80.0%78390.1%– 32.8%154126224Peugeot Rifter10.0%– 75.0%192350.1%+ 29.6%162141225Renault Kangoo10.0%– 66.7%168220.1%– 56.9%189129226BMW X710.0%– 50.0%163150.0%– 50.0%210169227Mercedes EQA10.0%– 50.0%24150.0%– 28.6%262246228BMW Z410.0%+ 0.0% –30.0%– 25.0%275268229Citroen C4 X10.0%+ 0.0%22890.0%– 65.4%239170230Jeep Wrangler10.0%+ 0.0%18980.0%+ 700.0%244274231Lamborghini Urus10.0%+ 0.0%25120.0%+ 0.0%293288232Land Rover Discovery10.0%+ 0.0% –40.0%– 66.7%269231233Mercedes GLS10.0%+ 0.0%236100.0%+ 42.9%235248234Subaru Crosstrek10.0%+ 0.0%179140.0%+ 133.3%218237235Alfa Romeo Giulia10.0%n/a –50.0%+ 25.0%259260236Alpine A29010.0%new23970.0%new249 –237Aston Martin Vantage10.0%n/a –20.0%n/a283 –238Audi RS Q810.0%n/a23460.0%+ 200.0%254282239Audi S510.0%n/a –120.0%+ 1100.0%224278240Audi S810.0%n/a –10.0%+ 0.0%310326241BYD Seal10.0%n/a –20.0%+ 100.0%288336242Dacia Dokker10.0%n/a –10.0%n/a318 –243Hyundai Staria10.0%new –10.0%new325329244Jeep Grand Cherokee10.0%n/a24240.0%n/a267330245Mazda CX-8010.0%new156210.1%new191245246Mercedes Citan Tourer10.0%n/a19140.0%n/a270 –247Mercedes S-Class10.0%n/a –120.0%+ 50.0%226235248Peugeot 50810.0%n/a –20.0%– 60.0%297262249Rolls Royce Cullinan10.0%n/a –10.0%n/a335 –250Suzuki Swace10.0%n/a24440.0%– 20.0%273266251Toyota Highlander10.0%n/a208190.1%+ 5.6%197186252Volvo EX4010.0%new –10.0%new338 –253Volvo XC9010.0%n/a219460.1%+ 24.3%145140
Source: ADS SLO


More Stories
Powerful Reasons Mercedes-AMG’s Latest GT Project Matters More Than You Think
From its base in Affalterbach, Mercedes-AMG has, recently, lifted the lid on a striking new direction for its GT line-up....
Top 5 Brands for Tailor-Made Car Accessories
Your vehicle deserves accessories that match your unique style and specific needs. While mass-produced car accessories serve basic functions, tailor-made...
How Car Finance Protects Your Buying Power in 2026
For many UK buyers, financing a vehicle isn’t just a way to “afford” a better car. It can be a deliberate choice to keep cash...
Hyundai Venus and Earth Concepts Signal a Bold New Ioniq Future for China
Hyundai has never been shy about taking a design risk, but the new Venus and Earth concepts feel like a...
A Chance To Win Tickets To The Wonderful Concours des Légendes 2026
We are delighted to offer you, our readers, another exciting competition. Are you signed up to our newsletter here, and...
How CGI Transforms Automobile Design & Prototyping
Car design has always depended on a mix of imagination, engineering, and revision. A sketch can set the direction, but...