
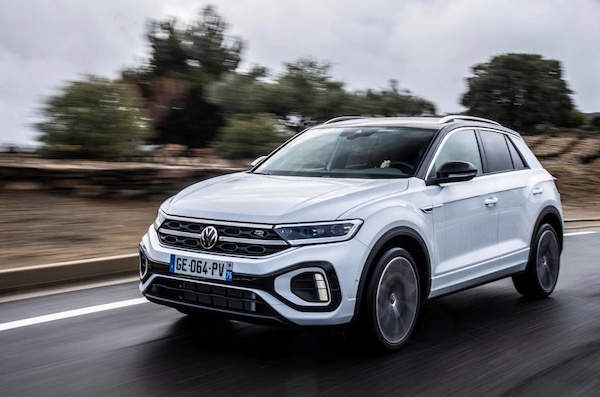
Germany July 2025: VW back up 25.5%, T-Roc best-seller in solid market (+11.1%)
The VW T-Roc is the most popular vehicle in Germany in July.
264,802 new cars hit German roads in July, up a fantastic 11.1% year-on-year. We are still 20% below the pre-pandemic levels of July 2019 (332,788). The YTD volume remains in negative however at -2.5% to 1,667,591, to be compared with 2,818,788 units at the same stage of the year in 2019. BEV sales amount to 48,614 for the month, up 58% YoY to 18.4% share vs. 12.9% in July 2024 but 20% in July 2023. Keep in mind that period 2024 was particularly bad for BEVs with the end of subsides as they fell -36.8% on the year prior in July. Year-to-date BEV registrations are up 38.4% to 297,340 and 17.8% share vs. 12.6% in 2024 and 16.4% in 2023.
Volkswagen (+25.5%) is back in shape after falling -20.7% in June, but its share, at 19.6%, remains below its YTD level of 20.3%. Mercedes (+7.1%) trails the market unlike BMW (+15.8%) and Skoda (+23.7%) both breathing on its neck. BMW lodges a 9.3% share vs. 8.6% YTD and Skoda is at 8.8% vs. 7.9%. Audi (-11.6%) disappoints and is now a distant 5th. Opel (+17.5%) and Ford (+29.2%) excel while Hyundai (+5.2%) is weak. Seat (-10.7%) and Toyota (-4.8%) can’t take advantage of the surging market. Meanwhile Mini (+54%), Renault (+47.5%), Cupra (+46.7% without the Leon), Porsche (+37%) and Dacia (+19.1%) impress below. BYD (+389.6%) is back above Tesla (-55.1%), both at a tiny 0.4% share.
We have a bit of a change atop the models charts, with the VW T-Roc (+19.6%) the clear leader for the month, almost 2,500 sales above the VW Golf (+39.8%). This is the nameplate’s first pole position since last August. The T-Roc even signs the largest monthly volume for a single car since June 2024. The VW Tiguan (+15.4%) is up one spot on June to #3 ahead of a surging BMW X1 (+44%). The Opel Corsa (+23.1%) is down two ranks to #5 but still beats the market. The Opel Astra (+16.5%), VW Passat (+15.4%) and Mercedes GLC (+12.1%) also impress in the remainder of the Top 10. The VW Tayron is the best-selling recent launch at #19 (-1), distancing the Skoda Elroq at #30 (-4), Dacia Bigster at #35 (+36) and already the brand’s best-seller in Germany, the Cupra Terramar at #60 (-12) and the Hyundai Inster at #76 (-11).
Previous post: Germany First Half 2025: Cupra (+67.6%) catches up on Seat (-27.1%), T-Roc (-4.7%) on Golf (-28.1%)
Previous month: Germany June 2025: Market falls -13.8%, VW off -20.7%, Opel Corsa on podium
One year ago: Germany July 2024: VW T-Roc repeats at #1, Skoda Karoq signs first Top 10 finish, BEVs off -36.8%
Full July 2025 Top 62 All brands and Top 375 All models below.
Germany July 2025 – brands:
PosBrandJul-25%/24Jun2025%/24PosFY241Volkswagen51,93819.6%+ 25.5%1337,93620.3%+ 2.2%112Mercedes24,6489.3%+ 7.1%2151,6129.1%+ 1.2%223BMW24,5239.3%+ 15.8%3143,6078.6%+ 5.7%334Skoda23,3798.8%+ 23.7%4132,3757.9%+ 7.5%445Audi17,1726.5%– 11.6%5114,9036.9%– 7.0%556Opel14,5515.5%+ 17.5%676,0244.6%– 15.2%667Ford11,5244.4%+ 29.2%764,6833.9%+ 7.6%788Hyundai9,4053.6%+ 5.2%855,1583.3%– 5.1%8109Toyota8,0763.0%– 4.8%1047,5972.9%– 10.6%10910Seat7,7572.9%– 10.7%1150,8233.0%– 25.0%9711Dacia7,2242.7%+ 19.1%942,6802.6%– 3.6%121112Kia5,9362.2%– 8.0%1735,9222.2%– 15.2%141213Cupra5,5532.1%+ 46.7%1346,3452.8%+ 64.8%111814Fiat5,3802.0%– 7.9%1533,1982.0%– 19.2%171515Volvo5,2652.0%– 5.6%1437,1542.2%– 0.5%131416Renault5,0721.9%+ 47.5%1233,8262.0%+ 13.0%161617Peugeot4,4791.7%– 15.9%1634,8672.1%– 8.2%151318Mini3,9191.5%+ 54.0%2119,1521.1%+ 9.4%222219Citroen3,8061.4%– 9.5%1828,6451.7%– 19.6%181720Porsche2,8371.1%+ 37.0%2319,3501.2%– 19.2%212121Nissan2,7031.0%+ 21.2%2219,9211.2%+ 6.6%202322Mazda2,5130.9%– 18.6%1922,8001.4%– 15.7%191923MG Roewe1,9860.7%+ 8.5%2413,5060.8%– 12.5%252624Suzuki1,9400.7%– 11.8%2513,6990.8%– 6.7%232525Land Rover1,4320.5%+ 31.4%298,2950.5%+ 6.7%272826Jeep1,1710.4%+ 40.7%287,9430.5%+ 10.5%282927BYD1,1260.4%+ 389.6%277,4490.4%+ 420.2%293728Tesla1,1100.4%– 55.1%2610,0000.6%– 57.8%262029Mitsubishi1,0500.4%– 36.1%2013,6540.8%– 25.8%242430Honda7900.3%+ 7.5%324,4780.3%+ 3.5%313031Alfa Romeo7010.3%+ 54.7%314,6530.3%+ 11.8%303132Polestar6700.3%+ 58.8%342,5850.2%+ 28.8%343533Leapmotor6380.2%new332,7050.2%new335534Lexus4150.2%– 3.0%352,9190.2%+ 10.7%323235Smart4120.2%– 12.5%382,3620.1%– 73.8%362736Subaru3330.1%– 12.4%362,5450.2%– 2.8%353337KGM2970.1%+ 113.7%371,8570.1%+ 49.0%393838Xpeng2660.1%+ 1562.5%401,3310.1%+ 2731.9%405039DS2540.1%– 15.6%421,9500.1%+ 3.2%383440GWM2160.1%– 20.0%302,1700.1%+ 31.9%373641Ferrari1600.1%– 19.2%411,1550.1%– 12.5%414042Man1540.1%+ 0.0%478720.1%– 3.0%424143Maserati1190.0%+ 153.2%514550.0%+ 31.1%484644Lamborghini1170.0%– 19.9%468350.1%+ 1.8%434245Ineos940.0%+ 118.6%433980.0%+ 21.7%494746Alpine840.0%+ 300.0%445350.0%+ 65.6%464847Iveco760.0%– 24.0%485890.0%– 15.9%454448Bentley620.0%+ 51.2%493710.0%– 26.7%504549Genesis 560.0%– 48.6%457020.0%+ 29.0%444350NIO470.0%+ 46.9%561670.0%– 37.2%544951Lucid 460.0%+ 475.0%551190.0%+ 63.0%565152Lotus370.0%– 9.8%502260.0%+ 16.5%515253Aston Martin360.0%– 7.7%521420.0%– 34.6%555454Rolls-Royce280.0%+ 7.7%541950.0%– 6.7%525355Lynk & Co170.0%+ 183.3%395020.0%+ 991.3%476056Vinfast100.0%+ 150.0%60830.0%+ 130.6%575657Chery90.0%new61200.0%new61 –58Cadillac70.0%– 81.1%57600.0%– 54.2%595759Maxus60.0%+ 100.0%53780.0%+ 66.0%585960Morgan50.0%– 28.6%59390.0%+ 0.0%606161Jaguar10.0%– 99.3%581930.0%– 87.2%533962Fisker10.0%+ 0.0% –20.0%– 98.5%6358 –Others1,1630.4%– 2.6% –6,9690.4%– 0.7% – –
Germany July 2025 – models:
PosModelJul-25%/24Jun2025%/24PosFY241VW T-Roc9,3973.5%+ 19.6%248,0232.9%– 0.8%222VW Golf7,0262.7%+ 39.8%150,7333.0%– 22.9%113VW Tiguan5,0721.9%+ 15.4%439,1742.3%+ 3.5%334BMW X14,9451.9%+ 44.0%527,5941.7%+ 41.4%685Opel Corsa4,9301.9%+ 23.1%328,0841.7%+ 15.9%576Skoda Octavia4,7651.8%+ 2.8%627,5351.7%– 14.9%747VW Passat4,2861.6%+ 15.4%728,1251.7%– 5.9%458Opel Astra4,1521.6%+ 16.5%921,0441.3%– 27.6%1369Mini All3,9191.5%+ 54.0%1119,1521.1%+ 9.4%161410Mercedes GLC3,5021.3%+ 12.1%1921,2831.3%+ 23.5%121511VW T-Cross3,3391.3%+ 6.5%1219,0061.1%+ 2.8%172212Fiat Ducato3,3231.3%+ 13.8%822,4471.3%+ 18.4%92713BMW 5er3,2791.2%+ 2.1%1021,4131.3%+ 62.9%112814Toyota Yaris/Cross3,2731.2%+ 3.9%2016,2261.0%– 6.4%261315BMW 3er3,1481.2%– 6.3%2118,6041.1%– 16.0%181116Skoda Kodiaq3,1391.2%+ 31.9%2717,4111.0%+ 31.1%223217Seat Leon3,1301.2%+ 20.8%1523,0841.4%– 6.0%8918Skoda Karoq3,1291.2%– 9.0%2216,5651.0%– 12.8%241619VW Tayron3,0401.1%new1813,8770.8%new3336120VW Transporter3,0331.1%– 9.5%1420,3191.2%– 11.8%151221Audi A32,9171.1%+ 7.4%2317,9961.1%– 9.1%191822VW ID.32,9071.1%+ 210.9%2517,5301.1%+ 23.1%214923VW ID.72,7651.0%+ 138.2%2820,7821.2%+ 552.1%146924VW ID.4, ID.52,6821.0%+ 108.4%3017,7541.1%+ 43.1%203925Skoda Kamiq2,5961.0%+ 28.1%3613,6740.8%– 1.2%373326Audi A62,5120.9%+ 0.4%1321,4861.3%+ 70.4%102927Ford Transit Custom2,4540.9%+ 193.2%4414,6470.9%+ 192.2%329428Skoda Fabia2,4370.9%– 2.5%3115,1600.9%– 13.8%312429BMW 1er2,3850.9%+ 47.2%2913,5870.8%+ 5.8%395230Skoda Elroq2,3810.9%new2611,7750.7%new4535231Mercedes V-Klasse/EQV2,3500.9%– 6.7%4313,6270.8%+ 3.4%384432Mercedes E-Klasse 2,3400.9%– 0.5%3815,2000.9%+ 7.2%303133Mercedes C-Klasse 2,3330.9%– 4.7%3416,1781.0%– 0.0%272534Skoda Enyaq2,3220.9%+ 35.2%4115,2950.9%+ 34.8%283035Dacia Bigster2,2790.9%new715,2310.3%new104 –36Opel Mokka2,1860.8%+ 8.5%1712,6790.8%+ 3.8%424037BMW X32,1560.8%– 10.3%3712,7390.8%– 21.4%412338BMW 2er2,1550.8%+ 36.9%4611,1770.7%– 4.3%485039Dacia Sandero2,1420.8%– 11.3%1616,2761.0%– 14.6%251740Ford Focus2,1010.8%– 23.2%5211,3820.7%– 16.1%473641BMW 4er2,0540.8%+ 7.8%4213,7330.8%– 0.2%353442Opel Grandland X2,0490.8%+ 65.8%578,7920.5%– 24.9%665143Audi A52,0310.8%+ 117.5%3513,7870.8%+ 102.3%348044Seat Ibiza1,9890.8%– 11.1%549,8020.6%– 28.4%534545Skoda Superb1,9780.7%+ 29.8%5110,5280.6%+ 7.0%496146Audi Q31,9640.7%– 24.0%6110,0460.6%– 29.3%514347Hyundai Tucson1,9470.7%+ 17.1%4011,5860.7%– 10.7%463848Cupra Born1,8940.7%+ 12.5%5312,1330.7%+ 53.1%436249Volvo XC601,8920.7%+ 31.1%3913,5370.8%+ 8.4%403750VW Taigo1,7890.7%– 20.7%2413,7140.8%– 19.5%362651VW Caddy1,7410.7%+ 10.5%4712,0810.7%+ 8.0%445352Audi Q51,7400.7%– 3.6%649,6380.6%+ 2.6%555853VW Polo1,6970.6%– 40.4%3315,2800.9%– 32.0%291054Volvo XC401,6180.6%+ 53.9%509,6090.6%+ 39.4%568655Mercedes A-Klasse 1,6150.6%+ 10.3%569,5880.6%– 5.5%575756Toyota Aygo X1,6020.6%+ 28.5%739,0370.5%– 14.0%615657Ford Puma1,5810.6%+ 58.6%729,3970.6%– 18.0%585558Cupra Formentor1,5700.6%– 25.3%4517,3771.0%– 13.9%232159Kia Ceed/Xceed1,5650.6%– 17.2%589,9940.6%– 23.9%524760Cupra Terramar1,5260.6%new4810,2180.6%new5025061Ford Kuga1,5240.6%– 19.6%888,9270.5%– 34.1%644262Hyundai Kona1,4890.6%+ 23.7%608,2070.5%+ 6.1%697363Mercedes CLA-Klasse1,4890.6%– 7.8%688,1210.5%– 19.9%706064Nissan Qashqai1,4670.6%+ 43.5%698,8990.5%+ 12.2%658265BMW X51,4450.5%+ 35.3%1036,9920.4%– 7.8%817666Kia Sportage1,4250.5%– 6.1%747,6880.5%– 19.4%726567VW Touran1,4030.5%– 36.5%639,0310.5%– 20.4%624868Seat Ateca1,3970.5%– 22.0%828,4960.5%– 36.7%683569Hyundai i101,3810.5%– 23.3%708,9720.5%+ 1.8%636770Dacia Duster1,3170.5%– 39.8%499,7710.6%– 28.1%544171Mercedes Vito1,2830.5%+ 58.6%765,8170.3%+ 9.0%9410672Citroen C3/C3 Aircross1,2770.5%+ 15.3%758,5420.5%– 40.7%676473Mercedes GLA1,2380.5%+ 36.9%807,4930.4%+ 11.5%747574Seat Arona1,2350.5%– 36.5%559,3310.6%– 22.1%595475Mercedes GLE1,1930.5%+ 34.3%626,7290.4%– 25.8%857776Hyundai Inster1,1710.4%new656,3410.4%new9136577Peugeot 20081,1500.4%– 20.2%937,0020.4%– 22.7%806878Audi A11,1380.4%– 8.7%797,2510.4%+ 2.3%777479Audi Q21,1370.4%– 37.6%1016,7290.4%– 21.6%847080Audi Q61,1270.4%+ 138.3%597,5760.5%+ 790.2%7317081Porsche 9111,1100.4%+ 155.8%977,1440.4%– 2.8%799682Ford Explorer1,1090.4%+ 634.4%995,4410.3%+ 1174.2%10016983Toyota Corolla/Cross1,0970.4%– 41.2%777,2290.4%– 28.3%785984Ford Transit, Tourneo1,0830.4%+ 14.0%956,1450.4%– 16.4%929285Opel Frontera1,0570.4%new783,7270.2%new13032786Hyundai i201,0560.4%+ 13.7%1186,0550.4%– 22.5%938487Fiat 5001,0540.4%– 58.2%1004,5720.3%– 73.7%1154688Audi Q41,0360.4%– 16.8%1127,2900.4%– 12.8%767889Suzuki Swift1,0300.4%+ 26.1%857,3980.4%+ 56.3%7510190Mercedes Sprinter1,0050.4%+ 21.4%966,4170.4%+ 13.5%9010591Mercedes EQA1,0040.4%+ 34.2%985,6020.3%– 8.3%988592Dacia Jogger9660.4%– 31.3%668,1170.5%– 8.5%716693Mercedes CLE9610.4%– 4.2%926,7170.4%+ 73.2%8611494Kia EV39390.4%new1195,1510.3%new10727595BMW X29280.4%+ 66.0%915,3180.3%+ 87.3%10112296Renault 59160.3%new1024,9720.3%new11124497Kia Picanto8950.3%+ 2.5%1115,5600.3%+ 0.5%999598Volvo XC908930.3%+ 26.5%945,7750.3%+ 17.4%959999Peugeot 2088630.3%– 30.1%849,2040.6%+ 37.5%6063100Mazda CX-308530.3%+ 12.2%836,9810.4%+ 33.4%82100101Mercedes EQB8170.3%+ 40.1%1164,6030.3%+ 23.3%114110102Peugeot 30087730.3%+ 20.6%865,3160.3%– 21.5%10291103Renault Austral7490.3%+ 12.0%905,1150.3%+ 34.1%108112104Hyundai Ioniq57390.3%– 40.2%1154,3680.3%– 12.8%118113105Toyota bZ4X7260.3%+ 640.8%1173,9870.2%+ 283.4%125214106Jeep Avenger7150.3%+ 113.4%1054,3280.3%+ 77.1%119140107VW ID.Buzz7130.3%+ 302.8%1205,2170.3%+ 167.1%106141108Citroen C5 X/Aircross7080.3%+ 21.9%1245,7050.3%– 5.5%9793109Renault Clio6970.3%– 13.2%876,5190.4%+ 5.9%8987110Ford Transit Connect6950.3%+ 55.8%1343,2620.2%– 5.4%135128111Toyota C-HR6800.3%– 27.0%815,7640.3%– 4.0%9688112Audi Q86750.3%+ 100.9%1214,9960.3%+ 97.2%110133113Hyundai i306720.3%– 35.4%1224,7560.3%– 44.5%11271114Mazda CX-606710.3%+ 161.1%895,2240.3%+ 44.8%105123115Mercedes B-Klasse6470.2%– 6.5%1314,4970.3%+ 5.1%116108116VW Touareg6440.2%+ 3.9%1383,9890.2%– 4.7%124119117Tesla Model Y6370.2%– 66.9%676,9420.4%– 62.7%8319118Skoda Scala6300.2%– 7.1%1084,4200.3%– 24.5%117102119Citroen C4/C4 X6200.2%– 40.1%1143,9970.2%– 36.2%12381120Citroen Jumper6070.2%– 28.8%1305,2950.3%– 18.1%10397121Fiat 6006010.2%+ 196.1%1284,0970.2%+ 579.4%122153122Mercedes GLB5970.2%– 10.6%1273,9670.2%– 15.5%126111123BYD Seal U5930.2%+ 1594.3%1443,0070.2%+ 1325.1%139273124Renault Captur5870.2%– 5.2%1044,6760.3%+ 29.7%113115125Mercedes G-Klasse5860.2%+ 29.1%1473,9390.2%+ 9.4%128124126MG RX65820.2%+ 410.5%1232,8980.2%+ 165.9%143186127Suzuki Vitara5700.2%+ 6.7%1293,9420.2%+ 17.1%127121128Cupra Tavascan5630.2%new1066,6170.4%new88211129Porsche Macan5530.2%+ 436.9%1423,6920.2%– 6.0%131118130Mercedes EQE5490.2%– 26.2%1433,5270.2%– 28.5%133104131Dacia Spring5180.2%+ 4216.7%1263,2500.2%+ 30.3%136157132Peugeot 3085180.2%– 56.5%1135,0910.3%– 29.8%10979133Land Rover Defender4970.2%+ 120.9%1592,4330.1%+ 22.0%155164134Mercedes Citan4960.2%+ 300.0%1393,3630.2%+ 26.1%134146135Renault Kangoo4860.2%+ 63.1%1482,4650.1%– 26.5%153136136Porsche Cayenne4830.2%– 31.6%1104,3040.3%– 33.7%12098137MG 34800.2%+ 370.6%1493,1230.2%+ 1206.7%138185138Tesla Model 34700.2%+ 4.4%1332,9360.2%– 36.8%141117139MG 44400.2%– 69.1%1253,7320.2%– 64.7%12983140Audi Q74380.2%+ 22.7%1633,1740.2%+ 91.4%137150141Leapmotor T034380.2%new1511,9910.1%new165311142Nissan Juke4350.2%– 10.9%1354,2340.3%+ 1.5%121120143Polestar 44310.2%+ 389.8%1901,2740.1%+ 1347.7%192257144Toyota Proace4130.2%– 36.9%1552,5380.2%– 22.8%150126145BMW iX4080.2%+ 42.7%1462,1650.1%– 10.1%161155146Ford Capri4010.2%new1721,5650.1%new180281147Peugeot 4083970.1%+ 56.3%1702,5110.2%+ 113.2%152188148Hyundai Santa Fe3950.1%+ 25.0%1561,8000.1%+ 189.9%170202149MG ZS3510.1%+ 134.0%1452,9660.2%+ 12.0%140158150Citroen Jumpy3480.1%+ 8.1%1372,8830.2%+ 159.0%144189151Alfa Romeo Junior3420.1%new1712,5170.2%new151289152Jeep Compass3420.1%– 3.1%1652,3410.1%– 10.9%157147153Ford Transit Courier3330.1%– 15.7%1682,3870.1%+ 25.2%156154154Kia Stonic3230.1%– 17.2%1522,2690.1%– 32.6%158130155Range Rover Sport3230.1%+ 54.5%1821,7700.1%+ 27.3%171193156Hyundai Bayon3190.1%– 19.8%1781,7430.1%– 37.6%172145157Volvo EX303170.1%– 73.4%1363,5430.2%– 42.2%132103158Volvo S/V603170.1%– 63.3%1612,8530.2%– 39.8%145109159Nissan X-Trail3130.1%– 31.4%1532,8080.2%– 16.7%146134160Mitsubishi ASX3060.1%+ 150.8%1731,9820.1%– 48.9%166137161Mazda33050.1%+ 8.9%1412,5810.2%+ 21.3%148156162VW Crafter3050.1%– 10.6%1542,2490.1%– 16.6%159149163Peugeot 50082940.1%+ 70.9%1322,5440.2%– 25.7%149131164Renault Rafale2940.1%+ 185.4%1602,0240.1%+ 334.3%164206165Mazda22920.1%– 53.4%1572,8980.2%– 48.3%142107166Renault Symbioz2910.1%+ 334.3%1501,9230.1%+ 2770.1%167218167Kia EV62820.1%– 37.9%1802,0280.1%– 33.5%163132168BMW X62800.1%– 23.7%1861,5980.1%– 26.5%179159169BMW X72760.1%– 4.2%1841,6900.1%– 17.1%177163170Porsche Taycan2760.1%– 14.6%1941,7230.1%+ 1.6%175151171Nissan Townstar2740.1%+ 134.2%1741,8430.1%+ 30.7%169183172BMW X42710.1%– 11.7%1951,6850.1%– 40.1%178144173Mitsubishi Outlander2670.1%#DIV/0!1921,0630.1%#DIV/0!203 –174BMW Z42660.1%– 11.3%1662,4410.1%+ 4.0%154165175Porsche Panamera2610.1%+ 2.8%2061,2740.1%+ 2.2%193195176Mitsubishi Colt2560.1%– 22.2%1692,7060.2%– 25.6%147139177Citroen Berlingo2460.1%– 19.9%1772,2200.1%+ 68.8%160173178Kia Sorento2430.1%– 32.5%2181,1390.1%– 53.9%198161179BMW 7er2390.1%– 11.2%1811,2970.1%– 30.2%191171180Toyota RAV42370.1%– 46.7%1832,1340.1%– 39.2%162127181Fiat Grande Panda2330.1%new2104260.0%new263 –182BYD Seal2320.1%+ 172.9%2368610.1%+ 166.6%214265183Peugeot Expert2280.1%+ 1528.6%1851,2430.1%+ 594.4%195294184Range Rover Evoque2280.1%+ 32.6%2041,3910.1%+ 11.2%185190185Renault 42260.1%new1874550.0%new259 –186Renault Arkana2250.1%+ 21.0%1671,5200.1%– 20.7%181152187Renault Espace2230.1%+ 57.0%1581,4290.1%+ 7.0%184181188Mercedes S-Klasse2080.1%– 35.0%1621,7270.1%– 19.7%174168189DS 72070.1%– 2.4%2371,3550.1%+ 15.1%186182190Alfa Romeo Stelvio2000.1%– 1.5%1981,0200.1%– 34.5%206187191Leapmotor C102000.1%new1887140.0%new226375192Mercedes GLS2000.1%– 20.0%1931,2070.1%– 50.1%196160193Peugeot Boxer1960.1%– 18.7%1961,4720.1%– 23.3%182174194Honda CR-V1840.1%+ 20.3%2261,1610.1%+ 36.4%197208195Smart #11830.1%– 34.4%2011,3400.1%– 71.6%189116196Honda Jazz1820.1%+ 95.7%2141,0850.1%+ 69.0%202234197Mazda CX-801820.1%#DIV/0!1641,7310.1%#DIV/0!173247198Suzuki SX41740.1%– 15.5%2001,4570.1%– 15.7%183162199Mitsubishi Space Star1690.1%– 82.2%326,6320.4%– 28.2%8772200Lexus LBX1660.1%+ 12.9%2248040.0%+ 42.6%218226201Renault Trafic1600.1%– 6.4%2328410.1%– 58.3%216166202Audi A71580.1%+ 53.4%2031,1200.1%+ 44.5%199207203Ford Mustang1580.1%+ 9.7%2051,0510.1%+ 8.7%204221204BMW 8er1550.1%+ 252.3%2575700.0%– 42.7%243231205Honda ZR-V1540.1%– 1.9%2645450.0%+ 12.6%247248206Range Rover 1530.1%– 13.6%2171,0300.1%+ 10.3%205219207Xpeng G61530.1%new2136890.0%new230318208Man TGE1510.1%+ 4.1%2398420.1%– 1.4%215229209Nissan Primastar1510.1%+ 104.1%1761,3090.1%+ 34.0%190213210Mazda MX-51500.1%– 29.9%1918110.0%– 24.6%217209211Polestar 21490.1%– 43.6%2299540.1%– 48.3%209184212Subaru Forester1480.1%+ 7.2%2198840.1%+ 25.0%211215213Suzuki Swace1470.1%+ 177.4%2465280.0%+ 40.8%248260214Smart #51440.1%new2703510.0%new274 –215GWM Ora 031430.1%– 13.9%1091,3440.1%+ 31.9%188198216Honda Civic1400.1%+ 21.7%2636030.0%– 1.6%238243217Volvo EX901340.1%new2207690.0%new221330218Kia EV91300.0%– 20.2%2828770.1%+ 9.8%212223219Renault Scenic1270.0%+ 5.0%1791,1140.1%+ 63.6%200201220Hyundai Staria1240.0%– 25.3%2235710.0%– 71.4%242177221Audi A41220.0%– 95.1%2021,7070.1%– 92.6%17620222Opel Zafira Life1190.0%– 67.8%2347380.0%– 45.2%222197223Honda HR-V1180.0%– 31.0%2161,0120.1%+ 5.4%207204224Range Rover Velar1150.0%– 31.5%2079870.1%– 19.7%208200225KGM Tivoli1080.0%+ 120.4%2255700.0%+ 39.4%244259226Kia Niro1080.0%– 85.9%2211,0920.1%– 72.2%201129227BYD Sealion 71030.0%new2156910.0%new229350228Xpeng G91020.0%+ 580.0%2445510.0%+ 1800.0%246302229Fiat Panda960.0%+ 77.8%2091,3470.1%– 50.3%187142230Lamborghini Urus950.0%+ 28.4%2496210.0%+ 33.3%235263231Ineos Grenadier940.0%+ 118.6%2123960.0%+ 21.1%266271232Land Rover Discovery Sport920.0%+ 5.7%2604870.0%– 23.5%253241233Polestar 3900.0%+ 28.6%1893560.0%+ 394.4%273300234Subaru Crosstrek900.0%+ 7.1%2426120.0%+ 77.4%237255235Mercedes EQS890.0%– 63.7%2288620.1%– 44.3%213179236Alfa Romeo Tonale850.0%– 36.6%2534970.0%– 67.2%252192237Smart #3850.0%– 54.1%2316650.0%– 43.5%232196238Mercedes AMG GT840.0%– 31.7%2556020.0%– 31.5%239227239Audi A8780.0%– 43.9%2407230.0%– 26.5%225212240Lexus NX750.0%– 21.9%2337990.0%– 3.6%219205241Alfa Romeo Giulia740.0%– 36.2%2386190.0%– 43.2%236220242Iveco Daily730.0%– 24.7%2515770.0%– 14.3%241242243Alpine A290710.0%new2303720.0%new271371244MG S5710.0%new2501490.0%new301 –245Subaru Outback690.0%– 28.9%2226510.0%– 13.3%234233246Lexus RX640.0%– 11.1%2353940.0%– 22.9%267238247MG Cyberster620.0%new3052260.0%new288376248Nissan Ariya610.0%+ 60.5%2767910.0%+ 188.7%220249249Hyundai Ioniq6600.0%– 67.9%2596730.0%– 61.5%231180250KGM Torres590.0%+ 43.9%2893330.0%+ 9.9%275261251Renault Master590.0%– 55.6%2674570.0%– 53.7%258225252BYD Atto 2580.0%new3247280.0%new223 –253Ford Mustang Mach-E540.0%– 80.6%2862560.0%– 82.2%283194254BYD Dolphin530.0%+ 12.8%3274470.0%+ 83.2%260280255Volvo S/V90530.0%– 80.1%2566620.0%– 52.2%233199256KGM Rexton520.0%+ 126.1%2842490.0%– 13.5%284286257Porsche Cayman520.0%– 17.5%2584280.0%– 49.0%262237258Lexus UX510.0%+ 50.0%2743740.0%+ 3.0%270254259Mitsubishi Eclipse Cross500.0%– 79.4%1401,2600.1%– 21.8%194138260Peugeot Rifter490.0%+ 600.0%2803600.0%+ 53.8%272285261GWM Wey 03480.0%+ 200.0%2432310.0%+ 225.4%287309262Bentley Continental470.0%+ 67.9%2772710.0%– 28.5%280274263BMW XM470.0%– 49.5%2733800.0%– 47.9%268232264Ferrari 296 GTB470.0%– 26.6%2653800.0%– 8.7%269266265Audi e-Tron GT460.0%– 78.6%2277070.0%– 26.7%227228266BYD Atto 3460.0%+ 0.0%2087240.0%+ 68.4%224236267Lucid Air460.0%+ 475.0%3001190.0%+ 63.0%308287268Jeep Renegade450.0%– 29.7%2485010.0%– 60.5%250210269Jeep Wrangler450.0%– 38.4%2416940.0%– 10.9%228235270Mercedes SL450.0%– 43.8%2784640.0%– 44.8%257230271Maserati Grecale420.0%+ 133.3%3102850.0%+ 51.6%277296272KGM Actyon400.0%new2882060.0%new292 –273Hyundai Ioniq9390.0%new336450.0%new335 –274Volvo C40390.0%– 32.8%2723990.0%– 49.1%265239275KGM Korando380.0%+ 46.2%2114990.0%+ 104.5%251277276Fiat Tipo370.0%– 73.9%2932420.0%– 82.3%285217277BYD Dolphin Surf360.0%new1078910.1%new210 –278Mazda6360.0%– 83.9%2524010.0%– 80.2%264172279NIO ET7350.0%+ 133.3%322800.0%– 8.0%319320280Ferrari Purosangue340.0%– 30.6%2832340.0%+ 1.3%286284281Maserati GranTurismo340.0%+ 385.7%330630.0%+ 96.9%324348282Toyota Land Cruiser330.0%+ 3.1%2624760.0%– 3.1%256216283VW Up!320.0%– 61.4%2681370.0%– 94.2%306178284Ferrari 12Cilindri290.0%new2911610.0%new298395285Fiat Ulysse290.0%+ 2800.0%341400.0%+ 81.8%338364286DS 4270.0%– 30.8%2754790.0%– 16.7%254245287Ferrari Roma270.0%+ 17.4%2851980.0%– 29.5%293290288Maserati Levante270.0%+ 145.5%331600.0%– 9.1%325329289Opel Combo270.0%– 69.0%2695090.0%– 61.2%249203290GWM Wey 05250.0%– 67.5%1995610.0%+ 12.4%245256291Renault Megane250.0%– 53.7%2662850.0%– 87.2%278175292Genesis G90240.0%+ 2300.0%335550.0%+ 266.7%329355293Jeep Grand Cherokee240.0%+ 242.9%302790.0%+ 11.3%320331294Land Rover Discovery240.0%– 40.0%2921970.0%– 38.8%294276295Lexus LM240.0%+ 20.0%3091410.0%+ 182.0%303305296Lexus RZ240.0%+ 100.0%2453120.0%+ 411.5%276314297Opel Movano230.0%– 53.1%2792730.0%– 28.9%279267298Lamborghini Coupe range220.0%– 69.4%2902140.0%– 39.5%290269299Mazda MX-30210.0%– 80.7%2542610.0%– 71.3%281222300Ferrari SF90/Stradale200.0%– 45.9%3081550.0%– 23.6%300298301Genesis G70170.0%– 29.2%325530.0%– 5.4%331325302Bentley Bentayga150.0%+ 25.0%313990.0%– 26.7%311307303DS No 8150.0%new340190.0%new352 –304Lotus Eletre140.0%+ 27.3%315870.0%– 3.3%317306305VW Arteon140.0%– 96.2%2985890.0%– 83.8%240135306Alpine A110130.0%– 38.1%2961400.0%– 56.7%304282307Lotus Emira130.0%– 35.0%2941120.0%+ 45.5%309317308Honda E:NY1120.0%– 73.9%287660.0%– 91.4%323252309Audi Q8 e-Tron110.0%– 96.5%2972600.0%– 92.7%282148310Lexus ES110.0%– 70.3%304900.0%– 50.3%314292311Peugeot 508110.0%– 91.3%3071240.0%– 90.3%307191312Subaru Impreza110.0%– 8.3%317550.0%+ 52.8%330340313Xpeng P7110.0%+ 1000.0%323910.0%+ 727.3%313358314Audi R8100.0%– 16.7%318430.0%– 92.2%337262315Lynk & Co 01100.0%+ 66.7%1754780.0%+ 939.1%255344316Toyota Prius100.0%+ 233.3%3121070.0%– 18.3%310303317Maserati Ghibli90.0%+ 350.0%343220.0%– 4.3%349353318Suzuki Ignis90.0%– 98.4%2712120.0%– 95.2%291125319Genesis GV6080.0%– 33.3%320810.0%+ 35.0%318326320Subaru BRZ80.0%– 82.6%2811840.0%– 21.0%296293321Cadillac Escalade70.0%– 30.0%333570.0%– 23.0%328328322Lotus Emeya70.0%– 22.2%342240.0%+ 100.0%347359323Subaru Solterra70.0%+ 133.3%2471590.0%+ 112.0%299313324Vinfast VF660.0%new –150.0%new356382325Fiat Scudo50.0%#DIV/0!346150.0%+ 50.0%355384326Lynk & Co 0850.0%new –50.0%new376 –327Maxus Mifa 950.0%n/a321380.0%– 13.6%339374328Mercedes Arocs50.0%+ 66.7%350110.0%– 38.9%363373329NIO ET550.0%– 16.7%370360.0%– 50.7%340324330Opel Crossland50.0%– 99.5%3061430.0%– 98.5%30289331Audi TT40.0%– 84.6%328230.0%– 97.6%348240332BYD Tang40.0%+ 100.0%299880.0%+ 104.7%315349333Vinfast VF840.0%+ 0.0%371680.0%+ 94.3%322310334DS 930.0%n/a345250.0%+ 1150.0%346370335Genesis G8030.0%– 57.1%295490.0%+ 58.1%332347336Genesis GV7030.0%– 94.7%2614440.0%+ 42.8%261264337Kia Rio30.0%+ 200.0% –130.0%– 85.4%360334338Kia Soul30.0%– 90.0%314310.0%– 91.7%344258339Opel Vivaro30.0%– 81.3%303320.0%– 70.6%342316340Porsche Boxster30.0%– 95.7%311880.0%– 93.1%316224341Renault Koleos30.0%– 85.7%35290.0%– 96.7%366288342Rolls-Royce Spectre30.0%– 25.0%344440.0%– 24.1%336336343DS 320.0%– 95.9%319720.0%– 44.6%321299344Lynk & Co 0220.0%#DIV/0!365190.0%#DIV/0!353 –345Mercedes Actros20.0%n/a367130.0%+ 30.0%361383346Mercedes Unimog20.0%n/a35750.0%+ 66.7%377391347NIO EL620.0%– 71.4%351220.0%– 51.1%350339348NIO ES820.0%– 50.0%369160.0%– 44.8%354354349Renault Twingo20.0%– 95.3% –140.0%– 99.4%358176350Renault Zoe20.0%– 71.4%35970.0%– 99.0%369253351Tesla Model S20.0%– 95.3%339600.0%– 76.6%326291352Toyota GR8620.0%– 90.9% –70.0%– 98.7%370268353Toyota Supra20.0%– 85.7%353470.0%– 66.7%333301354Aston Martin V810.0%– 92.9% –10.0%– 98.3%411343355Dacia Logan10.0%– 97.6%354290.0%– 88.6%345272356Ferrari F810.0%– 50.0% –40.0%– 69.2%378379357Fiat Doblo10.0%+ 0.0%355100.0%– 54.5%364366358Fisker Ocean10.0%+ 0.0% –20.0%– 98.5%386319359Genesis GV8010.0%– 88.9%356200.0%– 75.3%351321360Iveco Eurocargo10.0%– 66.7% –60.0%– 76.9%371360361Iveco Stralis10.0%#DIV/0!34740.0%#DIV/0!379 –362Jaguar F-Pace10.0%– 97.8%3371740.0%– 72.1%297246363Man TGL10.0%n/a348100.0%+ 66.7%365389364Man TGM10.0%– 75.0%349120.0%– 36.8%362362365Man TGS10.0%+ 0.0%36640.0%– 50.0%381386366Maserati Quattroporte10.0%+ 0.0% –10.0%– 80.0%402388367Mazda CX-510.0%– 99.8%1971,8900.1%– 70.8%16890368Mercedes Atego10.0%– 80.0%36860.0%– 62.5%372369369NIO EL710.0%n/a –30.0%– 90.6%383356370Seat Alhambra10.0%n/a –10.0%n/a404 –371Suzuki Across10.0%– 93.3%3261400.0%+ 37.3%305297372Tesla Model X10.0%– 98.0%332600.0%– 74.0%327295373Toyota Mirai10.0%– 90.9%301320.0%– 52.9%343312374Volvo FE10.0%n/a –10.0%n/a409 –375Volvo FM10.0%n/a37320.0%n/a392 –
Source: KBA


More Stories
How to Experience the Magic of Maserati’s 100-Year Racing Legacy at Goodwood Revival 2026
The Goodwood Revival (18-20 September) will shine a spotlight on one of Italy’s most evocative marques. In 2026, the event...
BMW Bringing Humanoid Robots to a German Factory Marks a Big Shift for the Future of Car Building
BMW Group is taking the next step into what it calls “Physical AI,” and this time it’s happening on home...
Mystery Toyota Rally Coupe Spotted Testing Could Hint at a New Celica Return
Toyota fans have been living in a bit of a golden era lately, and the rumor mill says there may...
Why Upgrading to LED Headlights is Essential for Your Vehicle
When it comes to vehicle lighting, switching from traditional halogen bulbs to LED headlight bulb is a game-changer. Lasfit’s LED...
How to Turn That Eyesore in Your Idaho Driveway Into Instant Cash
Photo Credit Idaho property owners often watch their once-reliable vehicles transform into permanent lawn ornaments as the harsh mountain winters...
United Arab Emirates January 2026: Jetour (+63.1%), Mitsubishi (+12.6%) impress in market off -1.8%
This content is for members only. Visit the site and log in/register to read.