
Australia July 2025: GWM, Chery at all time high in record market
The Chery Tiggo 4 Pro is up to a record 7th place in Australia in July.
Record-breaking mood in Australia in July: sales are up 2% year-on-year to 104,244, a new high July mark, eclipsing the previous all time best set in 2024 (102,181). The year-to-date tally, off just -0.9% to 728,374, is the 2nd highest 7-month total in history below just last year (725,278). Petrol sales drop -4.8% to 39,991 (289,490 YTD) but diesel is up 8% to 31,611 (217.092 YTD). HEVs edge down -1.6% to 17,757 (111,503 YTD) on a record year-ago volumes, BEVs soar 7.1% to 7,219 and 6.9% share vs. 6.6% a year go (54,364 YTD) and PHEVs surge 81.7% to 4,031 units (29,644 YTD). The sign of a healthy market, private sales soar 6.1% to 52,952 while business fleets edge up 1.6% to 37,636, rental sales climb 20.8% to 6,095 and government fleets fall -23.2% to 2,779.
SUVs shoot up 9.9% to 63,723 and 61.1% share vs. 56.7% a year ago and 58.9% in July 2023, light commercials build up 3.4% to 22,437 and 21.5% share vs. 21.2% a year ago and 19.9% two years back and passenger cars sink -22.4% to 14,449 and 13.9% share vs. 18.2% in 2024 and 17.7% in 2023. 6 states are up this month: Northern Territory is the most dynamic at +10.6% to 1,047, followed by Queensland at +8.9% to 22,806, Victoria at +3.1% to 27,496, Western Australia at +3% to 10,995, New South Wales at +1.9% to 30,940 and Australian Capital Territory at +1.6% to 1,441. Tasmania (-1% to 1,548) and South Australia (-1.4%) are less lucky. Looking at country of origin, Japan (-8.1%) again leads the way at 30,874 sales, followed by Thailand (-6.1%) at 20,596, China (+33.1%) at 19,997, South Koerea (+0.5%) at 13,179 and Germany (+7.5%) at 5,234.
The Kia Tasman has broken into the Australian Top 50.
Toyota (-4.3%) remain the outstanding leader in the Australian market, selling almost as much as the next three brands at 20.8% share. Despite a steep YoY fall, Mazda (-12.1%) is back up to #2 for the first time since February just as Kia (+11.8%) is the most dynamic in the Top 5, ending the month on the third step of the podium, also for the first time since February. Kia reaches its highest market share since last September at 7.1%. Ford (-6.1%) is relegated to third position with Hyundai (+11.1%) rounding out the Top 5. Below a weak Mitsubishi (-12.9%), GWM (+42.2%) repeats at an all-time high 7th place and breaks its share record at 4.5%. It distances BYD (+158%), down from a historical 5th position in June to #8 but still displaying astounding strength. Just outside the Top 10, fellow Chinese fare Chery (+267.4%) breaks all its records: ranking (#11), volume (3,149) and share (3%). MG (-27.9%) is in freefall and only the 4th best-selling Chinese brand. Tesla implodes -64.6% and is at -41.4% so far this year.
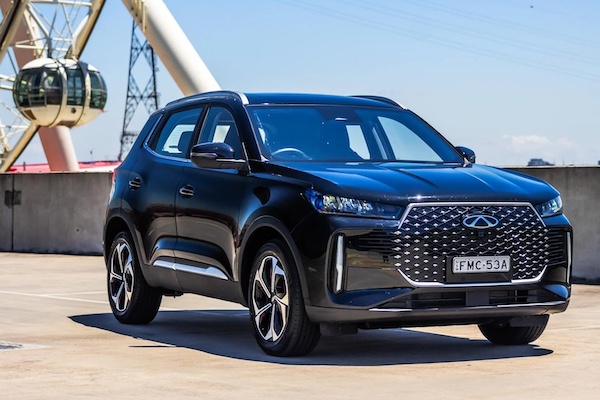
Looking at the models ranking, the Toyota Hilux (-1.5%) snaps its third win over the past four months but stays #2 year-to-date below the Ford Ranger (-20%) down to #3 for the month. In between is the Toyota RAV4 (-25.6%) down on record-breaking year-ago volumes. The Ford Everest (+12.2%) is up to #4, outselling its archenemy the Toyota Prado (#6, +11038.1%) for less than 100 units. The performance of the month is delivered by the new Chery Tiggo 4 Pro up 11 spots on June to break into the Top 10 for the first time at #7. The Toyota Corolla (-27%) is down sharply YoY but up 16 ranks on June to #8, the only passenger car in the Top 25. The Hyundai Tucson (+18%) and Kona (+29.5%) round out the Top 10 in very solid fashion. The BYD Shark 6 is down 19 spots on last month to #24 and ranks #13 YTD. Finally, notice the much awaited Kia Tasman up to #40 for its 2nd month in market, single-handedly enabling Kia to outsell Ford in July.
Previous month: Australia June 2025: BYD up to #5, China-built at 23% share
One year ago: Australia July 2024: Toyota RAV4 #1, hits all-time high volume in record market
Full July 2025 Top 55 All brands and Top 50 models below.
Australia July 2025 – brands:
PosBrandJul-25%/24Jun2025%/24PosFY241Toyota 21,72220.8%– 4.3%1142,70019.6%– 0.9%112Mazda 7,4527.1%– 12.1%356,3947.7%– 1.1%233Kia 7,4027.1%+ 11.8%648,1526.6%+ 0.5%444Ford 7,2797.0%– 6.1%254,5797.5%– 4.9%325Hyundai 6,6876.4%+ 11.1%445,6356.3%+ 8.4%566Mitsubishi4,9834.8%– 12.9%838,3625.3%– 15.4%657GWM4,7214.5%+ 42.2%729,9104.1%+ 20.4%7108BYD4,6074.4%+ 158.0%527,9623.8%+ 146.7%8179Isuzu Ute3,9863.8%+ 4.3%925,8693.6%– 13.0%9810Subaru 3,2643.1%– 9.4%1023,1743.2%– 8.6%121111Chery3,1493.0%+ 267.4%1417,2722.4%+ 235.2%132212MG2,9552.8%– 27.9%1224,6293.4%– 14.2%10713Nissan 2,6822.6%– 18.8%1323,2863.2%– 17.5%11914Mercedes2,5692.5%+ 31.9%1516,2752.2%+ 17.0%151515BMW2,4552.4%+ 15.3%1716,1672.2%+ 2.5%161416Volkswagen2,4002.3%– 5.4%1617,1762.4%– 19.8%141317Lexus1,3471.3%+ 6.4%228,6851.2%+ 15.0%202118Audi1,3041.3%+ 21.9%188,1431.1%– 12.0%221919Honda 1,1581.1%+ 0.5%219,2261.3%– 6.4%192020Suzuki 1,1251.1%– 35.1%209,6531.3%– 21.0%181621LDV1,1131.1%– 19.9%198,4531.2%– 17.0%211822Tesla9170.9%– 64.6%1115,0632.1%– 41.4%171223Land Rover7130.7%– 9.6%235,1040.7%+ 6.2%232424Volvo5250.5%– 33.1%254,1220.6%– 25.4%242325Geely4900.5%new242,3350.3%new30 –26Mini4860.5%+ 12.0%263,3290.5%+ 65.6%263027Porsche4420.4%– 5.2%283,4070.5%– 11.9%252528Omoda Jaecoo4340.4%new321,1240.2%new36 –29Renault4210.4%+ 4.5%272,8710.4%– 14.9%272630KGM Ssangyong3350.3%– 8.0%292,6150.4%– 26.6%282731Skoda3280.3%– 29.0%312,4820.3%– 27.2%292832Chevrolet3200.3%– 6.7%302,2560.3%– 4.4%312933Ram3200.3%+ 5.6%351,9830.3%– 15.5%323134Polestar2300.2%+ 123.3%341,4030.2%+ 33.2%343635Fiat1760.2%+ 3.5%421,0910.1%+ 9.9%373436Jeep 1650.2%+ 5.1%371,2370.2%– 14.0%353237Cupra1400.1%+ 13.8%331,7540.2%+ 37.8%333338Genesis1350.1%+ 12.5%369000.1%+ 8.4%393739Peugeot1150.1%– 23.8%388440.1%– 37.1%403540JAC1020.1%new391,0090.1%new38 –41Zeekr720.1%new405220.1%new41 –42IM530.1%new –530.0%new52 –43GMC480.0%new451180.0%new49 –44Leapmotor430.0%new443520.0%new434845Deepal400.0%new461390.0%new47 –46Jaguar340.0%– 35.8%413910.1%– 14.3%423847Alfa Romeo310.0%– 11.4%433130.0%– 22.9%443948Lamborghini210.0%– 32.3%481710.0%+ 6.2%454149Ferrari210.0%– 16.0%501210.0%– 12.3%484250Maserati190.0%– 54.8%471700.0%– 29.8%464051Bentley90.0%– 57.1%52680.0%– 44.7%514352Rolls-Royce40.0%– 63.6%54410.0%+ 10.8%534953Lotus30.0%– 82.4%51410.0%– 65.5%544454Aston Martin20.0%– 80.0%491080.0%+ 12.5%504555McLaren20.0%– 33.3%53410.0%– 6.8%5547
Australia July 2025 – models:
PosModelJul-25%/24Jun2025%/24PosFY241Toyota Hilux4,6764.5%– 1.5%230,9434.2%– 7.0%232Toyota RAV44,4154.2%– 25.6%928,4493.9%– 9.2%323Ford Ranger3,9303.8%– 20.0%132,2414.4%– 16.1%114Ford Everest2,4252.3%+ 12.2%614,7192.0%+ 9.5%665Isuzu D-Max2,3512.3%– 0.8%416,4162.3%– 9.7%546Toyota Prado2,3392.2%+ 11038.1%1117,9222.5%+ 409.3%4377Chery Tiggo 4 Pro2,0652.0%new1810,0611.4%new181178Toyota Corolla1,9631.9%– 27.0%2411,3221.6%– 28.6%1479Hyundai Tucson1,9141.8%+ 18.0%1012,1861.7%+ 9.9%101210Hyundai Kona1,9031.8%+ 29.5%813,1441.8%+ 26.2%91711Mitsubishi Outlander1,8691.8%– 11.4%3013,2681.8%– 19.8%8512Mazda CX-51,8211.7%– 10.3%713,8121.9%– 1.0%7813GWM Haval Jolion1,6871.6%+ 50.8%1410,7161.5%+ 29.9%162414Subaru Forester1,6761.6%+ 33.3%258,1711.1%+ 0.8%242515Isuzu MU-X1,6351.6%+ 12.6%139,4531.3%– 18.0%211516MG ZS1,5621.5%– 13.9%1511,7391.6%– 13.8%12917Mitsubishi Triton1,5401.5%+ 17.8%1210,7681.5%+ 1.1%151418Kia Sportage1,4641.4%– 3.4%1612,0221.7%+ 0.3%111019BYD Sealion 71,4271.4%new175,1830.7%new42 –20Toyota Land Cruiser Wagon1,4061.3%– 8.7%326,5140.9%– 39.0%302121Mazda CX-31,2931.2%– 19.6%209,5141.3%– 6.2%201322Mazda CX-301,2641.2%+ 0.1%277,4661.0%+ 0.4%272723Kia Carnival1,2401.2%+ 20.0%396,4130.9%+ 14.4%333424BYD Shark 61,2331.2%new511,6571.6%new13 –25GWM Haval H6/GT1,1681.1%+ 90.5%288,0771.1%+ 51.3%254126Toyota Camry1,1561.1%– 22.8%495,4150.7%– 55.9%372027Mazda BT-501,1321.1%– 1.7%228,9761.2%– 1.2%222228BYD Sealion 61,1231.1%+ 102.0%195,4980.8%+ 429.7%365629Nissan X-Trail1,0951.1%– 10.8%269,6481.3%– 9.6%191630Toyota Yaris Cross9580.9%+ 189.4%416,8450.9%+ 69.9%284631Toyota Land Cruiser PU/CC9160.9%– 0.9%366,1820.8%– 13.2%343032GWM Cannon9020.9%new373,7080.5%new5034333Hyundai i308930.9%+ 34.7%296,4720.9%– 9.8%312634Mazda38440.8%– 16.8%386,4430.9%– 0.9%323235Mitsubishi ASX8400.8%– 28.3%317,4961.0%+ 3.4%262936Kia Seltos8300.8%+ 43.4%475,2630.7%+ 2.9%414837Subaru Crosstrek7600.7%– 28.8%216,7620.9%– 4.4%293138Toyota Hiace7410.7%– 50.2%238,6651.2%+ 5.2%232339Toyota Kluger7360.7%– 56.8%355,3470.7%– 8.8%383640Kia Tasman6830.7%new1178900.1%newn/a –41Kia Sorento6620.6%– 14.4%405,8270.8%– 8.1%353842Kia K46580.6%new483,1610.4%new52 –43Hyundai Venue6550.6%+ 3.5%434,5950.6%+ 17.7%455144Nissan Navara6150.6%– 16.0%465,1030.7%– 20.0%433545Kia Picanto6070.6%+ 37.0%524,2860.6%+ 31.0%466146Suzuki Jimny5560.5%– 19.5%504,9210.7%– 8.9%443947BMW X15540.5%+ 35.5%683,2450.4%+ 21.8%686948Hyundai Santa Fe5520.5%– 13.2%643,7640.5%+ 22.5%646549Lexus NX5520.5%– 10.1%543,6320.5%+ 3.2%516050Subaru Outback5390.5%– 37.2%345,3100.7%– 20.1%3933
Source: VFACTS


More Stories
BMW Bringing Humanoid Robots to a German Factory Marks a Big Shift for the Future of Car Building
BMW Group is taking the next step into what it calls “Physical AI,” and this time it’s happening on home...
Mystery Toyota Rally Coupe Spotted Testing Could Hint at a New Celica Return
Toyota fans have been living in a bit of a golden era lately, and the rumor mill says there may...
Why Upgrading to LED Headlights is Essential for Your Vehicle
When it comes to vehicle lighting, switching from traditional halogen bulbs to LED headlight bulb is a game-changer. Lasfit’s LED...
How to Turn That Eyesore in Your Idaho Driveway Into Instant Cash
Photo Credit Idaho property owners often watch their once-reliable vehicles transform into permanent lawn ornaments as the harsh mountain winters...
United Arab Emirates January 2026: Jetour (+63.1%), Mitsubishi (+12.6%) impress in market off -1.8%
This content is for members only. Visit the site and log in/register to read.
Saudi Arabia January 2026: Haval (+147.5%), Isuzu (+51.9%) can’t prevent sinking market (-13.3%)
This content is for members only. Visit the site and log in/register to read.