
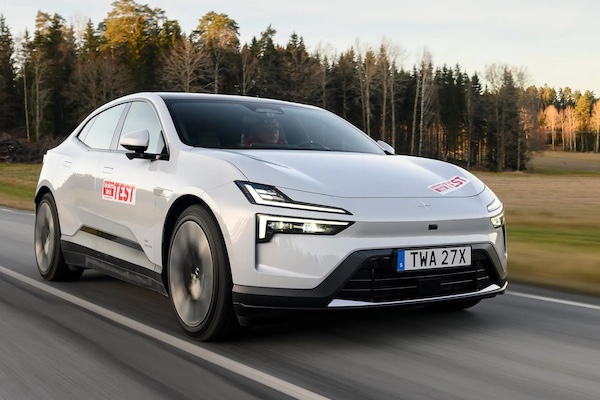
Sweden June 2025: Polestar 4 breaks into Top 5
The Polestar 4 is up to a fantastic 5th place in Sweden in June.
27,565 new cars hit Swedish roads in June, a solid 8.5% year-on-year improvement. The H1 2025 tally is up 6.6% to 140,976. Rechargeable cars account for a string 65.3% of the market in June vs. 56.5% last year. BEVs are up 17.6% to 10,725 and 38.9% share vs. 35.9% in June 2024 and PHEVs shoot up 38.6% to 7,264 and 26.4% share vs. 20.6% a year ago. Year-to-date, the share of rechargeable cars is 61.3% with BEVs up 18.2% to 35.2% share and PHEVs up 18.8% to 26.1% of the market.
Strikingly, the Top 5 brands all outpace the market with double-digit gains. Local behemoth Volvo (+19.3%) leads the way as usual but at 17% share it is below its YTD level of 18.3%. Volkswagen (+28.8%) does even better at #2, followed by Mercedes (+20%), Skoda (+38%) and Kia (+20.1%). Toyota (-13.7%) is the loser of the month, falling three spots on May to #6. In contrast BMW (+56.5%) delivers the biggest uptick in the Top 10 at #8, with Audi (+25.8%) also strong at #7. Polestar (+1.6%) is up to a record 9th place, Tesla freefalls -64.4% but MG (+149.3%), Opel (+83.7%), Fiat (+66.7%) and Porsche (+64.4%) impress below.
Over in the models charts, the Volvo XC60 (+27.1%) continues to dominate head and shoulders with 6.2% share compared with 3.4% for the #2, the Volvo XC40 (+89.5%). Distant leader a year ago, the Tesla Model Y (-59.1%) flounders but still manages a third place. The VW ID.7 (+323.5%) is down one spot on last month to #4 while the Polestar 4 (+8262.5%) is up eight to a record 5th position, the nameplate’s very first incursion inside the Swedish Top 10. The Volvo EX30 (-2.4%) follows ahead of the new Kia EV3 down three ranks to #7.
Previous month: Sweden May 2025: Audi (+59.2%), Skoda (+43.8%) and Polestar (+39%) impress
One year ago: Sweden June 2024: Polestar breaks all records
Full June 2025 Top 56 All brands and Top 285 All models below.
Sweden June 2025 – brands:
PosBrandJun-25%/24May2025%/24PosFY241Volvo4,68717.0%+ 19.3%125,82518.3%+ 8.8%112Volkswagen3,64313.2%+ 28.8%220,19714.3%+ 49.9%223Mercedes 1,8666.8%+ 20.0%68,7166.2%+ 6.9%564Skoda 1,8046.5%+ 38.0%78,4926.0%+ 54.0%685Kia 1,7456.3%+ 20.1%49,1816.5%– 0.5%456Toyota 1,6235.9%– 13.7%310,4727.4%– 8.1%347Audi 1,5965.8%+ 25.8%58,2375.8%+ 19.2%778BMW 1,4995.4%+ 56.5%87,5785.4%+ 19.4%899Polestar1,0103.7%+ 1.6%103,6152.6%+ 28.9%101110Tesla9763.5%– 64.4%123,6112.6%– 60.7%11311Peugeot 8373.0%– 16.0%94,9993.5%+ 5.7%91012MG7132.6%+ 149.3%251,2600.9%– 12.9%211913Cupra6042.2%+ 24.5%113,2742.3%+ 35.7%121214Renault5852.1%+ 34.8%162,2391.6%+ 10.6%151515Ford 4781.7%+ 2.1%132,6251.9%– 12.9%141316Opel 4611.7%+ 83.7%231,1910.8%– 0.6%222317Porsche3931.4%+ 64.4%201,6641.2%– 10.5%181618Fiat 3501.3%+ 66.7%171,4141.0%+ 90.3%202619Hyundai 3371.2%– 8.4%191,7571.2%– 10.4%172020Nissan 3001.1%+ 4.9%141,7921.3%+ 6.6%161721Dacia2841.0%– 29.7%211,4731.0%– 1.9%191822Lexus2580.9%+ 108.1%221,1880.8%– 2.7%232223Seat2130.8%– 19.9%189260.7%– 42.7%252124Mazda 2000.7%– 3.4%249490.7%– 21.7%242425Citroen 1890.7%– 38.6%276230.4%– 54.9%282526Zeekr1550.6%+ 400.0%266270.4%+ 119.2%272827Mini 1210.4%+ 175.0%307070.5%+ 75.4%263128Suzuki 1010.4%– 20.5%295290.4%– 47.3%302729Lynk & Co820.3%– 53.1%155930.4%– 12.7%293030BYD810.3%+ 1.3%324720.3%– 5.4%333231Xpeng720.3%+ 157.1%284790.3%+ 93.1%313332Honda 700.3%– 35.2%314730.3%– 32.9%322933Land Rover380.1%– 29.6%342840.2%+ 2.2%343534SsangYong370.1%+ 825.0%57390.0%+ 200.0%405635Mitsubishi320.1%– 20.0%351750.1%– 46.8%353436Jeep200.1%+ 900.0%44770.1%+ 1440.0%364837Alfa Romeo110.0%– 21.4%39650.0%+ 75.7%374638Subaru 100.0%– 96.5%332,7041.9%+ 40.3%131439Ferrari90.0%+ 0.0%37330.0%– 5.7%424240Lamborghini80.0%– 27.3%46280.0%– 26.3%434441Ineos70.0%+ 40.0%41570.0%+ 54.1%384542Hongqi70.0%– 70.8%47220.0%– 66.7%473643Chevrolet 60.0%– 14.3%38400.0%+ 42.9%394344Geely60.0%– 40.0%36340.0%+ 183.3%413845Lotus60.0%+ 100.0%40270.0%+ 8.0%444946Smart50.0%– 50.0%45270.0%+ 0.0%454147DS50.0%+ 400.0%50200.0%– 13.0%485348Man50.0%+ 150.0%48140.0%+ 75.0%525149Alpine40.0%n/a5660.0%+ 50.0%566250Iveco30.0%+ 0.0%43140.0%+ 55.6%515751DFSK20.0%n/a42150.0%n/a50 – 52Morgan20.0%n/a5190.0%+ 350.0%556153NIO10.0%– 85.7%49170.0%– 74.6%493754Cadillac10.0%n/a5450.0%+ 150.0%575855Aston Martin10.0%– 80.0%5540.0%– 55.6%585456Maserati10.0%n/a–30.0%– 40.0%6059–Others50.0%– 58.3%–280.0%– 94.1%––
Sweden June 2025 – models:
PosModelJun-25%/24May2025%/24PosFY241Volvo XC601,7006.2%+ 27.1%19,7226.9%+ 31.7%122Volvo XC409383.4%+ 89.5%25,0263.6%+ 17.8%233Tesla Model Y8673.1%– 59.1%73,0332.2%– 58.9%414VW ID.78303.0%+ 323.5%34,5183.2%+ 695.4%3165Polestar 46692.4%+ 8262.5%132,0301.4%+ 7707.7%13696Volvo EX306402.3%– 2.4%52,6361.9%– 24.0%647Kia EV35141.9%new42,4841.8%new71458VW Tiguan4561.7%– 1.9%102,2191.6%+ 7.5%11129Volvo S/V604201.5%– 40.6%62,6801.9%– 37.3%5510VW ID.44171.5%– 42.7%112,3901.7%+ 4.6%9711Skoda Kodiaq3861.4%+ 43.0%82,4681.8%+ 154.2%82712Skoda Enyaq3761.4%+ 70.9%142,2401.6%+ 105.9%101113VW T-Roc3751.4%+ 130.1%241,6811.2%+ 23.0%191814VW Passat3491.3%– 3.1%202,1631.5%+ 38.3%121515Toyota RAV43431.2%– 15.9%191,9601.4%– 33.6%15616Toyota Corolla3281.2%+ 1.2%171,8891.3%+ 6.6%182417Fiat Ducato3261.2%+ 79.1%271,2880.9%+ 120.9%325118Kia Sportage3171.2%– 9.2%331,3541.0%– 34.4%311019Audi A33151.1%+ 12.9%121,6161.1%+ 28.5%222820Mercedes E Class3081.1%+ 9.6%251,4841.1%+ 6.9%282921MG 42941.1%+ 82.6%1543980.3%– 43.6%936522MG 52801.0%+ 3400.0%884610.3%+ 265.9%8616923Kia Ceed2711.0%– 7.8%211,9141.4%– 21.6%16824Toyota C-HR2621.0%+ 63.8%281,2630.9%+ 14.2%334025VW Tayron2570.9%new319350.7%new42 –26Skoda Octavia2530.9%– 11.8%591,1300.8%– 13.6%373227Volvo C402520.9%– 3.8%151,5351.1%– 3.5%271428Audi A6 e-tron2450.9%new161,0790.8%new38 –29Toyota Yaris2390.9%– 27.1%221,6301.2%+ 5.0%212530Volvo XC902380.9%– 5.2%321,1680.8%– 16.7%363131Peugeot 50082380.9%+ 33.0%401,0240.7%– 12.9%402032Volvo S/V902350.9%+ 61.0%231,9781.4%+ 94.1%142633VW ID.32350.9%+ 158.2%421,5871.1%+ 52.0%243834BMW X32310.8%+ 80.5%657580.5%+ 8.9%515835Peugeot 20082290.8%+ 7.0%291,6121.1%+ 100.7%233436Peugeot 30082280.8%– 39.0%91,5631.1%– 11.2%263737Polestar 22250.8%– 76.0%481,1790.8%– 56.0%35938Toyota Yaris Cross2170.8%– 12.1%181,5641.1%+ 5.0%251739Opel Mokka2170.8%+ 130.9%906700.5%+ 26.9%597240BMW 5-Series2110.8%+ 240.3%431,4461.0%+ 85.6%294541Audi A52110.8%+ 681.5%695580.4%+ 246.6%7313142Audi Q4 E-Tron2040.7%+ 13.3%361,2620.9%– 17.1%343043Mercedes GLC2040.7%+ 25.2%398030.6%– 3.7%484444Skoda Superb1950.7%+ 97.0%785570.4%+ 41.0%746045Kia EV61900.7%+ 42.9%468710.6%– 1.4%443346Cupra Terramar1880.7%new441,0630.8%new3920747Mercedes GLE1870.7%+ 36.5%866140.4%+ 3.4%656748Dacia Sandero1810.7%– 40.8%518300.6%– 11.1%453649Skoda Kamiq1790.6%+ 68.9%546560.5%– 11.1%616250Mercedes EQB1780.6%+ 13.4%566510.5%– 19.7%624951BMW 3-Series1780.6%+ 140.5%527700.5%+ 0.9%494752VW Golf1760.6%– 23.8%381,9081.4%+ 21.8%172353Kia EV91690.6%– 18.8%379710.7%– 14.3%414154Renault Scenic1690.6%+ 322.5%1004790.3%+ 369.6%8410655Kia Niro1650.6%– 23.3%677580.5%– 47.9%522256Audi Q31610.6%– 3.0%1016780.5%+ 3.5%585357BMW i51600.6%+ 83.9%507560.5%+ 135.5%538258Toyota Corolla Cross1590.6%– 50.2%261,4231.0%– 9.0%302159Volvo EX901590.6%new496360.5%new6317460Mercedes EQA1570.6%+ 106.6%587440.5%+ 55.6%547061Nissan Qashqai1480.5%+ 10.4%456830.5%+ 3.3%574862Skoda Elroq1480.5%new475740.4%new70 –63Porsche Macan1420.5%+ 468.0%845930.4%+ 164.7%688164Audi Q6 e-Tron1400.5%+ 4566.7%419120.6%+ 30300.0%438365Porsche Cayenne1370.5%+ 53.9%795140.4%– 41.3%795666Lexus NX1370.5%+ 185.4%686070.4%– 9.1%666367BMW IX11360.5%new534910.3%new8127168Skoda Fabia1350.5%– 52.5%984830.3%– 33.9%825969Mercedes EQE1340.5%+ 12.6%817680.5%– 3.8%504270Renault 51340.5%new613650.3%new103 –71Skoda Karoq1320.5%+ 222.0%1183840.3%+ 69.2%9611372Zeekr 7X1320.5%new852280.2%new129 –73Cupra Tavascan1280.5%new876700.5%new6013674BMW X11240.4%– 12.7%608170.6%– 19.2%474675Audi A61220.4%– 32.6%348280.6%– 17.7%463576Mercedes C Class1200.4%– 36.5%556040.4%– 28.4%674377Seat Leon1160.4%+ 7.4%913540.3%– 33.7%1068078Cupra Leon1140.4%+ 72.7%735770.4%+ 38.0%697579MG ZS1130.4%+ 1.8%2141530.1%– 54.7%1576680Peugeot 2081130.4%+ 653.3%824170.3%+ 329.9%9214781Renault Master1110.4%+ 117.6%1562600.2%+ 47.7%12414682Cupra Born1100.4%– 64.7%634430.3%– 67.5%903983BMW iX1100.4%+ 400.0%1113290.2%+ 41.8%10911084Tesla Model 3 1080.4%– 82.5%1145550.4%– 68.1%751385VW Taigo1080.4%+ 36.7%955480.4%– 9.7%776886Polestar 31050.4%+ 114.3%1133140.2%+ 223.7%11310387Mercedes CLA1050.4%+ 208.8%647030.5%+ 109.9%557788VW Multivan1000.4%+ 51.5%765200.4%+ 63.0%7812789Opel Corsa990.4%+ 3200.0%1861750.1%+ 1650.0%14918290Ford Kuga980.4%+ 237.9%1214710.3%– 47.5%855791BMW i4960.3%– 31.9%627020.5%– 7.1%565592Ford Transit950.3%+ 251.9%743930.3%+ 65.1%9513493Seat Arona930.3%– 30.6%355510.4%– 36.5%765094Mazda CX-60900.3%+ 50.0%1043630.3%– 36.4%1047395VW T-Cross 890.3%– 20.5%924500.3%– 36.9%886496Mercedes A Class880.3%+ 300.0%752020.1%+ 50.7%13916897VW ID.Buzz870.3%+ 26.1%964520.3%+ 68.7%8712298Renault Rafale870.3%new1271500.1%new15922999Ford Explorer860.3%+ 2050.0%803730.3%+ 7360.0%100185100Dacia Duster850.3%+ 18.1%775040.4%+ 14.0%8093101Hyundai Tucson850.3%+ 84.8%1084800.3%+ 42.0%83101102BMW X5840.3%– 3.4%575630.4%– 6.6%7161103Mercedes Sprinter840.3%+ 3.7%833750.3%+ 6.2%9990104Citroen C4830.3%+ 3.8%1153190.2%– 29.3%11292105BYD Seal U720.3%+ 928.6%973290.2%+ 840.0%110198106Hyundai i10710.3%– 11.3%1262260.2%– 34.5%130124107Nissan Ariya700.3%+ 48.9%666220.4%+ 259.5%64114108Opel Frontera690.3%new189830.1%new189 –109Opel Grandland X650.2%+ 20.4%1431930.1%– 52.9%14191110Hyundai Kona650.2%+ 85.7%1033390.2%+ 7.6%107107111Audi Q8650.2%+ 170.8%1053710.3%+ 118.2%101112112Mazda CX-80630.2%new1092850.2%new117180113Porsche 911610.2%+ 117.9%943390.2%– 11.3%108111114Ford Courier600.2%+ 650.0%1251160.1%+ 176.2%173232115Citroen C3 Aircross590.2%– 33.7%1191080.1%– 69.7%178121116Lynk & Co 01560.2%– 68.0%304360.3%– 35.8%9171117VW Caddy560.2%– 9.7%1421930.1%– 29.0%142123118Suzuki Vitara540.2%+ 80.0%1462030.1%– 25.6%138119119BMW IX2530.2%+ 96.3%1172160.2%– 0.5%132140120Mini Hatch530.2%+ 253.3%1412780.2%+ 14.9%119102121BMW 2-Series520.2%– 8.8%1022720.2%– 1.4%122100122Kia Sorento500.2%– 59.3%703670.3%– 27.8%10278123Cupra Formentor500.2%– 41.2%893820.3%– 15.1%9752124Audi Q5490.2%– 43.7%1383760.3%+ 5.6%9879125Mercedes GLS490.2%+ 32.4%1581550.1%– 24.0%156154126Xpeng G6490.2%new933200.2%new111172127Mercedes GLA470.2%– 13.0%1202950.2%– 8.4%11494128Lexus LBX440.2%+ 83.3%1732090.1%+ 113.3%135149129Kia Stonic390.1%– 43.5%1531910.1%– 51.2%14386130Mini Aceman390.1%new1691890.1%new145272131Ford Capri390.1%new1671060.1%new179234132Mercedes GLB380.1%– 46.5%992480.2%+ 0.4%126109133Honda CR-V380.1%+ 153.3%1441900.1%+ 134.6%144196134BMW 1-Series370.1%– 44.8%1392910.2%– 6.1%11595135Hyundai Santa Fe370.1%+ 184.6%1301830.1%+ 205.0%147178136SsangYong Rexton370.1%n/a –370.0%+ 516.7%220312137Nissan Juke350.1%– 35.2%1102520.2%+ 21.2%125115138Audi Q2340.1%– 50.0%1281360.1%– 69.5%16584139Toyota Aygo X340.1%– 15.0%1401740.1%– 29.0%150125140VW Crafter340.1%– 2.9%1321410.1%+ 6.0%162159141Toyota bZ4X320.1%+ 6.7%724480.3%+ 32.9%8999142Audi Q7320.1%+ 190.9%1601560.1%+ 262.8%155165143Mercedes EQS320.1%+ 700.0%1911250.1%+ 267.6%168209144Citroen C5 Aircross310.1%– 38.0%224510.0%– 78.8%211129145Mercedes CLE310.1%+ 6.9%1242040.1%+ 108.2%137153146Ford Transit Custom310.1%+ 1450.0%1471190.1%+ 325.0%172233147Kia Picanto300.1%– 51.6%1122700.2%– 23.1%12385148Ford Tourneo Connect300.1%+ 275.0%172830.1%+ 88.6%190217149VW Touran300.1%n/a1652250.2%+ 5525.0%131190150Nissan X-Trail290.1%– 32.6%1631880.1%– 2.6%146138151Mini Countryman290.1%+ 3.6%1222400.2%+ 81.8%127135152Renault Captur280.1%+ 0.0%1552780.2%– 24.3%12088153VW Touareg270.1%– 6.9%1371460.1%– 32.4%160139154Mercedes G Class260.1%+ 766.7%1621460.1%+ 117.9%161171155Lynk & Co 02260.1%new711570.1%new154 –156Hyundai Ioniq 5250.1%– 49.0%1291760.1%– 30.7%148137157Renault Clio240.1%– 78.9%1362740.2%– 48.0%12174158Hyundai i20240.1%– 62.5%182900.1%– 45.8%184167159Porsche Panamera230.1%– 41.0%199880.1%+ 11.4%185181160Xpeng G9230.1%– 14.8%1511530.1%– 32.9%158116161Lexus ES/IS/LS/RC230.1%+ 4.5%1501210.1%– 20.4%169161162Mercedes Vito220.1%+ 22.2%1451100.1%– 9.1%177177163Range Rover 210.1%– 4.5%1591670.1%+ 28.5%152173164Lexus UX 210.1%new188880.1%new186188165Mercedes V Class180.1%– 37.9%1492080.1%– 12.6%136130166Suzuki Swift180.1%– 37.9%1231650.1%– 40.0%153120167Dacia Jogger180.1%– 30.8%1661390.1%+ 11.2%163133168Mercedes Citan180.1%– 14.3%1341150.1%+ 12.7%174189169Mazda2180.1%– 10.0%203760.1%– 61.2%194151170Jeep Avenger180.1%+ 800.0%247720.1%+ 1700.0%196241171Zeekr 001170.1%– 32.0%1711110.1%– 56.5%176105172Lexus RX160.1%– 27.3%157860.1%– 44.2%188170173Porsche Taycan160.1%+ 0.0%194650.0%– 39.3%200155174Ford Tourneo Custom160.1%+ 1500.0%1072310.2%+ 83.3%128148175Mitsubishi Outlander160.1%n/a –160.0%n/a243 –176Audi A1150.1%– 73.2%1701730.1%– 17.6%151132177Mazda CX-30150.1%– 63.4%1831340.1%– 25.1%166142178Honda HR-V150.1%– 11.8%1481280.1%+ 64.1%167175179VW Caravelle140.1%– 88.3% –770.1%– 62.1%193144180Suzuki S-Cross140.1%– 73.1%210620.0%– 83.1%204117181Porsche 718140.1%– 66.7%190650.0%– 66.1%201163182Fiat 500140.1%– 48.1%246350.0%– 73.3%223162183Cupra Ateca140.1%– 36.4%1521390.1%– 23.6%164118184Peugeot 308130.0%– 88.2%1311210.1%– 75.3%170104185Hyundai Bayon130.0%– 75.0%181720.1%– 67.6%197158186Ford Puma 130.0%– 27.8%1802120.2%– 38.4%134126187Suzuki Swace130.0%– 7.1%164690.0%– 8.0%199191188Mercedes CL class130.0%+ 30.0%204360.0%– 29.4%221221189MG HS130.0%n/a1962140.2%– 17.4%133143190Lexus RZ130.0%n/a161580.0%+ 31.8%206235191Nissan Townstar130.0%n/a290170.0%+ 1600.0%240326192Renault Austral120.0%– 76.0%1842790.2%– 23.4%11896193Citroen Jumper120.0%– 7.7%206410.0%+ 2.5%217208194Renault Megane 110.0%– 82.5%178530.0%– 72.0%210176195Polestar YSM110.0%new135920.1%new182 –196Honda Jazz100.0%– 33.3%198730.1%– 8.8%195195197BMW 4-Series100.0%+ 25.0%195350.0%– 50.7%224202198MG 3100.0%+ 100.0%213250.0%+ 316.7%233205199Ford Mustang90.0%– 69.0%217280.0%– 15.2%230230200Subaru Solterra90.0%– 30.8%1161200.1%+ 8.1%171187201Range Rover Evoque90.0%+ 350.0%205290.0%+ 16.0%229245202Hyundai Ioniq 680.0%– 46.7%168360.0%– 36.8%222215203Renault Trafic70.0%– 85.7%216480.0%– 49.5%213183204Hongqi E-HS970.0%– 70.8%232220.0%– 66.7%235201205Ineos Grenadier70.0%+ 40.0%219570.0%+ 54.1%207227206Alfa Romeo Junior70.0%new227450.0%new214 –207Land Rover Defender60.0%– 33.3%192640.0%– 8.6%203204208Zeekr X60.0%+ 0.0%1932880.2%+ 829.0%11697209Fiat 60060.0%+ 500.0%176970.1%+ 3133.3%181211210Opel Combo60.0%n/a291100.0%+ 233.3%263327211Opel Astra50.0%– 95.0%226570.0%– 76.2%208150212Mazda MX-3050.0%– 89.4%283430.0%– 60.9%216197213BMW X750.0%– 76.2%179500.0%– 59.0%212179214Mitsubishi Eclipse Cross50.0%– 66.7%25290.0%– 93.7%267184215Hyundai i3050.0%– 64.3%177830.1%– 17.0%191199216Honda Civic50.0%– 50.0%207440.0%– 51.1%215203217Mazda350.0%– 44.4%212390.0%– 27.8%219214218Peugeot Expert50.0%– 44.4%208310.0%+ 19.2%226274219BYD Seal50.0%– 28.6%229590.0%– 16.9%205212220Lamborghini Urus50.0%+ 0.0%277160.0%+ 100.0%244283221Mitsubishi Space Star50.0%+ 400.0%233130.0%– 50.0%253255222Mercedes EQT50.0%+ 400.0%28670.0%+ 133.3%277296223Toyota Land Cruiser50.0%n/a260230.0%+ 2200.0%234213224DS 750.0%n/a243190.0%+ 90.0%239281225Peugeot 40840.0%– 95.3%2351980.1%– 33.1%14076226Citroen C340.0%– 94.7%1971010.1%– 62.5%180156227Mazda MX540.0%– 84.0% –80.0%– 85.5%273223228Mitsubishi ASX40.0%– 83.3%174540.0%– 49.1%209186229Seat Ibiza40.0%– 82.6%257210.0%– 84.8%236192230Peugeot Boxer40.0%– 50.0%255150.0%– 34.8%248254231Alfa Romeo Tonale40.0%– 42.9%236140.0%– 48.1%250249232Ferrari40.0%+ 100.0%231130.0%+ 18.2%254290233Toyota Proace Verso40.0%+ 300.0%185880.1%– 26.7%187166234Hyundai Inster40.0%new202720.1%new198 –235Lotus Eletre40.0%n/a281170.0%+ 6.3%241259236Alpine A11040.0%n/a26260.0%+ 50.0%284313237Fiat 500X40.0%n/a –40.0%– 84.0%297278238Smart #540.0%new –40.0%new298 –239BYD Dolphin30.0%– 85.0%239650.0%– 43.5%202160240VW ID.530.0%– 81.3%201410.0%– 80.7%218141241Audi A730.0%– 62.5%211170.0%– 48.5%242239242Lexus UX EV30.0%– 50.0%280110.0%– 88.3%260320243BMW X230.0%– 40.0%228160.0%+ 33.3%245284244Chevrolet Corvette30.0%– 25.0%230200.0%+ 100.0%238251245BMW X430.0%– 25.0%238110.0%– 73.2%259238246Nissan Primastar30.0%+ 0.0%289210.0%– 8.7%237243247Iveco Daily30.0%+ 0.0%225130.0%+ 62.5%255282248Lamborghini30.0%+ 50.0%27560.0%– 68.4%285276249Peugeot Rifter30.0%n/a215160.0%– 48.4%246252250MAN SKÅP30.0%new24960.0%new286302251Honda ZR-V20.0%– 81.8%218270.0%– 41.3%232219252BMW X620.0%– 75.0%268140.0%– 63.2%251225253BMW Z420.0%– 66.7%270110.0%– 50.0%261266254Nissan Leaf20.0%– 60.0%23490.0%– 97.9%270128255Suzuki Across20.0%+ 0.0%221300.0%+ 130.8%228237256Ferrari Purosangue20.0%+ 0.0%24490.0%+ 200.0%268304257Man Chassi Husbil20.0%+ 0.0%28280.0%+ 0.0%274261258Ferrari SF9020.0%+ 0.0%24560.0%+ 50.0%287293259Mitsubishi Colt20.0%n/a175830.1%+ 88.6%192200260Morgan20.0%n/a25390.0%n/a269307261MG Cyberster20.0%new25060.0%new288344262Jeep Wrangler20.0%n/a27450.0%+ 400.0%293324263DFSK E520.0%new24240.0%new299 –264Ford Focus10.0%– 99.7%1873980.3%– 63.0%9454265Subaru Forester10.0%– 97.9% –5600.4%+ 131.4%7298266Renault Kangoo10.0%– 95.0%200310.0%– 66.7%227206267Range Rover Velar10.0%– 94.4%256120.0%– 64.7%258257268Mercedes AMG GT10.0%– 93.3%1331150.1%+ 91.7%175194269Renault Espace10.0%– 83.3%209160.0%– 55.6%247226270BMW i710.0%– 83.3%267130.0%– 40.9%256258271Smart #310.0%– 83.3%259100.0%– 28.6%264260272BYD Tang10.0%– 75.0%240150.0%– 28.6%249248273NIO EL710.0%– 75.0% –10.0%– 93.3%323270274Tesla Model S10.0%– 66.7% –90.0%– 70.0%271231275Lotus Emira10.0%– 66.7%22070.0%– 22.2%279300276BMW 7-Series10.0%– 50.0%26670.0%– 65.0%278267277Aston Martin Vantage10.0%– 50.0% –20.0%+ 0.0%313338278Lexus LM10.0%+ 0.0%24880.0%+ 300.0%275264279Land Rover Discovery10.0%n/a27850.0%n/a294323280Lotus Emeya10.0%new –30.0%new302315281Maserati10.0%n/a –30.0%+ 0.0%303291282MG S5 EV10.0%new25130.0%new304 –283Cadillac Lyriq10.0%new27120.0%new314 –284Ferrari 81210.0%n/a –10.0%– 50.0%324318285Mercedes SL 10.0%n/a –10.0%+ 0.0%325354
Source: Mobility Sweden

More Stories
Iraq H1 2026: Jetour (+29.2%), Great Wall (+6.9%) defy market down -26.4%
This content is for members only. Visit the site and log in/register to read.
Jordan H1 2026: Changan returns at #3, Toyota Hilux distant leader
This content is for members only. Visit the site and log in/register to read.
Oman H1 2026: Jetour up to #2 brand, Ram 1500 surges to #5
This content is for members only. Visit the site and log in/register to read.
Kuwait H1 2026: Nissan Patrol #1, Haval up 200%
This content is for members only. Visit the site and log in/register to read.
Qatar H1 2026: Haval (+155.2%), Tank (+45.9%) stun, new Jetour G700 inside Top 10
This content is for members only. Visit the site and log in/register to read.
2026 Mercedes-AMG CLE 53 Pricing: What to Know Before Buying the Coupe or Cabriolet
The Mercedes-AMG CLE 53 occupies a genuinely distinctive position in the luxury performance segment: a two-door, four-seat coupe or convertible...