
USA May 2025: Employee pricing sends Ford Motor up 16.4%, stable market
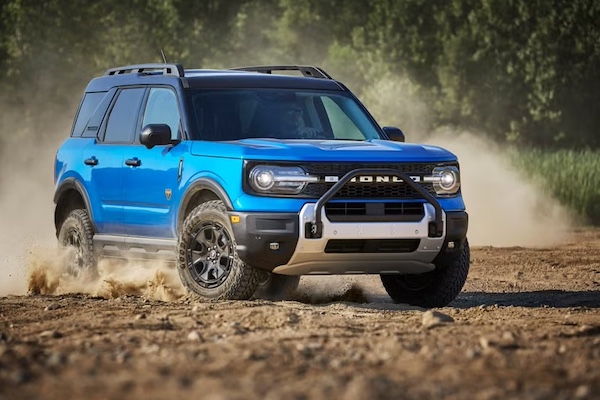
Ford Bronco sales are up 51.1% year-on-year in May.
The rush to secure a new vehicle ahead of expected price increases in the wake of tariffs has slowed down in May, with sales up just 1.4% on the year prior to an estimated 1,469,000 units. Light trucks are up 4.9% to 1,215,000 and 82.7% share while passenger cars drop -12.8% to 254,000 units and 17.3% share. The SAAR stands at 15.6 million vs. 15.8 million a year ago, 17.2 million in April and 17 million in March. Some US analysts predict May is likely to be the last month showing an upwards trend, as many manufacturers such as Ford, Subaru, Mitsubishi and Hyundai have said they will raise prices in the coming weeks. Note according to J.D Power and GlobalData, some 53.6% of vehicles sold in May are assembled in the U.S. compared to 52.2% a year ago in May 2024.
The average transaction price in May stands at $45,462, up 1.4% year-on-year but down -1.3% on April. Average incentives per vehicles are at $2,563, falling -7% on last month. As expected, inventory is declining at 2.49 million units at the start of May vs. 2.69 million at the start of April. Leasing accounts for 20.7% of the market in May vs. 24% a year ago. Meanwhile fleet sales are off -7% year-on-year to 254,000, accusing for 17.1% share vs. 18.3% last year. ICE are at 74.9% share vs. 79% a year ago, HEVs stand at 14.8% share vs. 10.5% in May 2024, PHEVs are at 2.1% share vs. 2% and BEVs account for 8.1% of sales, actually down from 8.5% a year ago.
Ford sold almost 80,000 F-Series but only 1,902 F-150 Lightning EVs.
Among OEMs still sharing monthly volumes, Ford Motor is up 16.4% as it continues to offer employee-style discounts, Toyota Motor is up 10.9%, Hyundai-Kia up 6.7% and American Honda up 6.5%. Looking at brands, Ford (+15.3%) is back up above Toyota (+12.3%) for just 773 sales. As for others, Lincoln is the most dynamic at +39%, with Volvo (+14.7%) and Genesis (+13.6%) also strong. Hyundai (+7.7%) and Kia (+5.1%) both lodge their 8th consecutive month of year-on-year gains. Note Ford EV sales sink -25% to 6,723 as the F-150 Lightning EV falls -42% to 1,902.
Model-wise, the Ford F-Series jumps 14.9% almost 80,000 units, which could be its best tally since March 2021 (84,043). The Toyota Camry (+20.9%) and Tacoma (+55.1%) are both in great shape, while the Honda Civic (+7.6%), Toyota RAV4 (+6.1%) and Honda CR-V (+1.7%) are more discreet. The Ford Bronco (+51.1%), Bronco Sport (+45.7%), Escape (+23.6%) and Explorer (+22.6%) score some of the biggest gains in market.
Previous month: USA April 2025: Pre-tariff rush lifts market up 10%
One year ago: USA May 2024: Toyota (+15.7%), Lexus (+17.3%), Lincoln (+28%) stand out in shy market
Full May 2025 for OEMs, brands and models still reporting monthly sales below.
USA May 2025 – OEMs reporting monthly sales:
OEMMay-25/242025/24Toyota Motor Corporation240,176+ 10.9%1,043,490+ 5.0%Ford Motor Co219,847+ 16.4%926,040+ 6.2%Hyundai-Kia170,251+ 6.7%752,778+ 10.9%American Honda135,432+ 6.5%624,665+ 8.2%Subaru52,292– 10.4%275,260+ 3.0%Mazda28,937– 18.6%176,913+ 6.1%Volvo Cars11,646+ 14.7%56,091+ 8.5%
USA May 2025 – brands still reporting monthly sales:
BrandMay-25/242025/24Ford208,274+ 15.3%879,121+ 5.8%Toyota207,501+ 12.3%892,598+ 4.4%Honda122,743+ 7.3%567,191+ 8.3%Hyundai84,521+ 7.7%369,578+ 11.4%Kia79,007+ 5.1%352,662+ 10.0%Subaru52,292– 10.4%275,260+ 3.0%Lexus32,675+ 2.4%150,892+ 8.7%Mazda28,937– 18.6%176,913+ 6.1%Acura12,689– 0.4%57,474+ 7.1%Volvo11,646+ 14.7%56,091+ 8.5%Lincoln11,573+ 39.0%46,919+ 13.0%Genesis6,723+ 13.6%30,538+ 16.5%
USA May 2025 – models still reporting monthly sales:
ModelMay-25/242025/24Ford F-Series79,817+ 14.9%342,971+ 19.5%Toyota RAV445,282+ 6.1%202,641– 1.9%Honda CR-V37,848+ 1.7%182,656+ 11.0%Toyota Camry31,337+ 20.9%129,995– 0.5%Toyota Tacoma26,504+ 55.1%109,365+ 100.6%Honda Civic25,809+ 7.6%108,338+ 0.4%Toyota Corolla23,461+ 10.5%101,390– 2.3%Ford Explorer20,504+ 22.6%88,807– 6.0%Hyundai Tucson19,905+ 14.6%96,932+ 23.4%Ford Escape17,395+ 23.6%67,655+ 7.4%Kia Sportage17,063+ 10.0%74,542+ 12.0%Subaru Crosstrek15,793+ 14.1%74,340+ 15.5%Hyundai Elantra15,741+ 18.3%62,356+ 24.0%Ford Maverick15,508+ 13.9%73,706+ 13.8%Subaru Forester15,434+ 0.6%84,629+ 3.5%Ford Transit15,219– 4.1%62,139– 8.8%Toyota Grand Highlander14,819+ 17.4%53,841+ 10.3%Ford Bronco14,629+ 51.1%61,624+ 46.5%Ford Bronco Sport14,472+ 45.7%59,721+ 21.4%Honda Accord 14,017+ 1.6%55,906– 17.9%Toyota Tundra13,956– 8.8%63,532– 2.9%Kia K4/Forte13,870+ 5.6%63,970+ 8.2%Honda HR-V13,258– 3.4%68,114+ 4.5%Kia Telluride11,560+ 12.1%52,263+ 16.5%Ford Expedition11,298+ 43.2%35,896– 3.9%Honda Pilot11,220– 10.7%56,019+ 2.8%Subaru Outback11,214– 32.1%62,649– 3.4%Hyundai Palisade11,207+ 10.4%47,944+ 7.6%Hyundai Santa Fe11,030+ 0.3%54,848+ 17.1%Toyota Sienna10,541+ 95.9%44,417+ 61.8%Toyota Corolla Cross9,844+ 2.2%43,729+ 19.9%Mazda CX-59,501– 24.6%56,501– 2.7%Kia Sorento9,093+ 3.0%43,869+ 10.4%Lexus RX8,859– 8.4%44,780– 1.3%Honda Odyssey8,712+ 14.2%40,491+ 25.2%Hyundai Kona7,779– 6.4%32,711– 17.5%Mazda CX-507,188+ 14.0%38,243+ 39.6%Kia Carnival6,975+ 68.0%27,954+ 61.8%Kia K56,957+ 256.8%28,951+ 220.4%Lexus NX6,957+ 27.9%32,026+ 15.0%Toyota Highlander6,696– 24.8%24,985– 51.2%Toyota 4Runner6,662– 40.9%24,358– 57.3%Toyota Prius6,659+ 41518.8%30,161+ 96.4%Ford Ranger6,319+ 34.4%28,238+ 157.9%Hyundai Sonata6,082– 9.2%27,891+ 10.6%Lexus TX5,496+ 10.1%20,418+ 7.7%Honda Passport5,480+ 74.0%22,635+ 65.8%Kia Seltos5,254– 18.7%20,680– 23.2%Kia Soul5,043– 12.1%21,389– 10.5%Ford Mustang5,010– 3.2%19,309– 18.0%Ford Mustang Mach-E4,724+ 11.0%19,258+ 2.8%Toyota Land Cruiser4,508+ 246.0%24,451+ 1650.3%Hyundai Venue4,349+ 74.4%12,879+ 19.0%Mazda CX-304,329– 47.9%31,622– 28.9%Honda Ridgeline4,289+ 150.5%19,514+ 15.1%Mazda CX-904,046– 12.0%24,601+ 34.6%Hyundai Ioniq 53,898– 12.4%15,920+ 6.3%Acura MDX3,880– 38.6%18,751– 13.0%Subaru Ascent3,547– 32.8%18,384– 19.8%Lexus ES3,517– 12.4%16,092+ 0.5%Lincoln Nautilus3,498+ 24.0%16,003+ 7.2%Ford E-Series3,379– 5.4%16,757– 0.9%Volvo XC603,275– 2.6%19,490+ 26.8%Lexus GX3,267+ 29.8%16,465+ 120.3%Volvo XC903,245+ 4.0%16,749+ 10.7%Volvo XC403,175+ 80.0%11,719+ 5.5%Genesis GV703,130+ 19.2%12,965+ 31.9%Hyundai Santa Cruz3,031– 15.9%12,173– 18.7%Acura RDX2,931– 9.6%15,594– 7.3%Lincoln Navigator2,843+ 133.0%9,646+ 75.5%Lincoln Aviator2,749+ 42.2%10,313+ 1.0%Lincoln Corsair2,483+ 5.6%10,957+ 0.8%Subaru Impreza2,457+ 1.6%12,923+ 4.0%Mazda32,453– 7.7%15,040– 0.8%Toyota Sequoia2,387– 2.3%10,096– 4.1%Kia Niro2,354– 44.2%9,822– 33.3%Genesis GV802,256+ 40.6%10,416+ 25.3%Honda Prologue2,110+ 244.8%13,518+ 1817.4%Acura ZDX1,873+ 2156.6%9,017+ 10763.9%Subaru Legacy1,793+ 17.4%9,469+ 24.4%Lexus IS1,785– 0.4%8,548– 0.5%Acura Integra1,776– 30.7%8,494– 25.9%Acura ADX1,542new2,690newToyota Crown Signia1,387new11,205newToyota bZ4X1,352+ 7.3%8,026– 1.1%Subaru Solterra1,246– 19.4%5,326+ 28.4%Hyundai Ioniq 61,197+ 8.9%5,621– 6.3%Mazda CX-701,065+ 683.1%7,378+ 3976.2%Volvo S60/V601,051– 34.7%3,019– 66.1%Toyota Crown916– 58.6%4,132– 66.8%Lexus RZ911– 38.8%3,016– 32.2%Lexus UX884– 6.4%4,337– 6.8%Toyota GR86851– 57.0%4,618– 22.6%Kia EV6801– 69.9%5,195– 40.8%Genesis G70773– 17.0%3,951– 15.2%Acura TLX687+ 29.1%2,928– 21.6%Lexus LX679+ 33.7%3,150+ 12.7%Subaru WRX482– 71.2%6,081– 23.6%Volvo EX30390new2,211newMazda MX-5 Miata355– 62.9%3,528+ 9.3%Subaru BRZ326+ 43.6%1,459+ 24.6%Toyota Supra325– 20.0%923– 24.5%Hyundai Ioniq 9302new302newGenesis G80297– 25.6%1,538– 14.6%Volvo EX90245new1,565newVolvo S90/V90245+ 20.1%955+ 35.7%Genesis GV60148– 43.5%1,073+ 8.5%Lexus RC124– 38.3%711– 10.7%Genesis G90119+ 25.3%577– 5.7%Lexus LC103– 35.6%725– 12.8%Lexus LS93– 50.3%624– 41.7%Kia EV937– 98.3%4,025– 48.2%Volvo C4020– 78.0%375– 23.6%Toyota Mirai6– 66.7%40– 82.2%Toyota Venza6– 99.9%689– 96.0%Toyota Avalon2n/a4– 20.0%
Source: Manufacturers


More Stories
Canada June/Q2 2026: Toyota(+12%), Volkswagen (+26.2%) stand out
VW Tiguan sales triple year-on-year over Q2. According to local consultancy DesRosiers Automotive, new light vehicles sales in June end...
Belgium June/H1 2026: Fleet BEVs at 59% share, Mercedes CLA and BMW iX3 stun
The BMW iX3 is an instant blockbuster in Belgium. The Belgian new car market is up by a solid 9.4%...
Incredible Reasons to Visit Classic Nostalgia 2026 at Shelsley Walsh
Classic Nostalgia 2026 is nearly here, and anticipation continues to grow. On 18–19 July, the historic Shelsley Walsh Hill Climb...
Days-on-Market for RV Dealers: How to Catch an Overpriced Unit Before It Sits
An overpriced RV does not announce itself. It just sits, quietly, while the dealer assumes it will move any week...
Bugatti W16 Era Ends With the Final Mistral Roadster and a 1,578 HP Farewell
Bugatti has officially reached the end of one of the most outrageous engine chapters in automotive history. After years of...
Honda Prologue EV Killed Off After 2026 as Brand Steps Back From U.S. Electric SUV Push
Honda is pulling the plug on the Prologue after just three model years, bringing an early end to the brand’s...