
Australia April 2025: GWM and Chery break records, Toyota Hilux #1
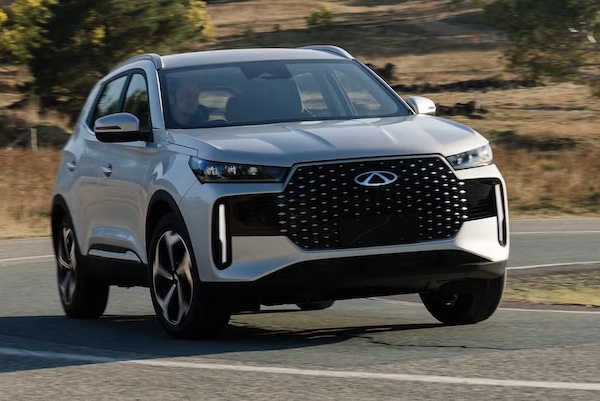
First Australian Top 20 finish for the Chery Tiggo 4 Pro
New vehicle sales in Australia drop -6.1% year-on-year in April to 91,316 units, leading to a year-to-date volume off -3.6% to 387,273. Private sales fall -8.9% to 44,568, business fleets edge down -4.9% to 34,159 but rental fleets surge 21.2% to 5,914. Government fleets skid -18.5% to 2,547. SUV sales edge up 0.9% year-on-year to 54,605 and 60.3% share vs. 55.7% last year and 56% two years ago, light commercials are down -4.6% to 20,436 and 22.6% share vs. 22% in 2024 and 20.8% in April 2023, and passenger cars freefall -25.8% to 12,849 and 14.2% share vs. 17.8% last year and 18.5% two years ago. Heavy commercials amount to 3,426 and 3.8% share.
Petrol sales drop -10.4% to 36,352, diesel is down -3.2% to 28,639 and for once HEVs actually fall at -6% to 14,288. BEVs are also in negative at -3% to 6,010 while PHEVs soar 95.4% year-on-year to 2,601. However the end of the Fringe Benefits Tax (FBT) exemption for PHEVs from April 1 meant deliveries of this format are down -62% on the 6,932 of March. Looking at sales by state and region, all of them are in negative this month. New South Wales is down -7.5% to 27,071, Victoria down -7.9% to 24,410, Queensland off -3.2% to 20,203, Western Australia down -1.4% to 9,664, South Australia down -13.6% to 5,864, Tasmania down -18.5% to 1,366, Australian Capital Territory down -17% to 1,198 and Northern Territory off -2.4% to 838. As far as country of production is concerned, Japan (-7.7%%) maintains its lead with 27,994 sales ahead of Thailand (-16.3%) at 19,207, China (+18.7%) at 15,619, South Korea (-10.7%) at 11,092 and the US (+37.7%) at 2,709.
In the brands charts, Toyota (-6.7%) matches the market to 21.2% share, above its YTD level of 19.9%. Ford (-15.2%) suffers in 2nd place ahead of Mazda (-10%), also in trouble. Kia (-5.3%) resists somewhat while sister brand Hyundai (+7%) overtakes a struggling Mitsubishi (-20.7%) for 5th place. Chinese fare GWM (+16.3%) is up to a best-ever 7th spot, also reached last February, and breaks its share record at 4.2%. Nissan (+27%) is also in great shape at #8 unlike Isuzu Ute (-21.8%) at #9. BYD (+127.4%) holds itself into the Top 10 at #10, something MG (-17.9%) can’t do at #11. This is MG’s first fall outside the Top 10 since June 2024. Chery (+290.9%) posts the best performance of the entire market, breaking its volume and share records at 2,287 and 2.5%. Tesla is down -75.9%.
The Toyota Hilux (-12.2%) takes the lead of the models charts for the first time since September 2023 with 4.5% share. It ends the month 90 units above its archenemy the Ford Ranger (-27.6%) while the Toyota RAV4 (-35%) freefalls and completes the podium. The RAV4 stays at #1 year-to-date for now. The Ford Everest (-6.9%) is back up to #4, outselling its competitor the Toyota Prado (+1198.3%) by just one sale. The Kia Sportage (+0.1%) sports its best monthly ranking so far this year at #7 with the Toyota Corolla (-20.8%) back inside the Top 10 for the first time since last August at #8. The Nissan X-Trail (+32.5%) scores its first Top 10 finish of the year at #9 while the Hyundai Kona (+23.2%) and GWM Haval Jolion (+29.2%) are just as dynamic. The BYD Shark 6 drops from #6 in March to #16 this month, still a solid result in the absence of PHEV tax rebates. The new Chery Tiggo 4 Pro breaks into the Top 20 for the first time at #19.
Previous month: Australia March 2025: BYD #1 Chinese brand, BEVs down -19.9%
One year ago: Australia April 2024: Another record market, Toyota RAV4 and Ford Everest at all time high
Full April 2025 Top 52 All brands and Top 20 models below.
Australia April 2025 – brands:
PosBrandApr-25%/24Mar2025%/24PosFY241Toyota 19,38021.2%– 6.7%177,17719.9%+ 0.2%112Ford 7,3348.0%– 15.2%228,7337.4%– 8.3%323Mazda 6,5737.2%– 10.0%331,6928.2%+ 2.0%234Kia 6,3036.9%– 5.3%426,0376.7%+ 1.8%445Hyundai 5,5476.1%+ 7.0%623,8336.2%+ 3.5%566Mitsubishi4,2124.6%– 20.7%523,2776.0%– 8.7%657GWM3,8744.2%+ 16.3%815,4534.0%+ 14.2%7108Nissan 3,6904.0%+ 27.0%914,3633.7%– 16.5%999Isuzu Ute3,3303.6%– 21.8%1112,4453.2%– 27.0%10810BYD3,2073.5%+ 127.4%711,9743.1%+ 103.3%121711MG3,1033.4%– 17.9%1014,5083.7%– 10.5%8712BMW2,6512.9%+ 27.8%168,2792.1%+ 4.6%151413Subaru 2,4312.7%– 25.1%1212,0673.1%– 13.1%111114Chery2,2872.5%+ 290.9%178,3442.2%+ 234.0%142215Volkswagen2,0762.3%– 26.8%149,2752.4%– 21.1%131316Mercedes1,9672.2%– 4.4%158,2242.1%+ 18.0%161517Lexus1,2211.3%+ 14.2%204,5391.2%+ 11.9%212118Suzuki 1,1521.3%– 29.0%195,6161.5%– 18.8%181619Honda 1,0891.2%– 8.6%185,3311.4%– 9.2%192020LDV1,0451.1%– 11.3%224,6061.2%– 19.5%201821Land Rover7290.8%+ 21.3%232,6920.7%+ 15.2%232422Audi6680.7%– 52.7%214,0601.0%– 17.6%221923Tesla5000.5%– 75.9%135,6601.5%– 61.9%171224Porsche4520.5%+ 22.5%261,8980.5%– 14.8%252525Mini4230.5%+ 80.8%251,8170.5%+ 71.9%263026Volvo4040.4%– 44.5%242,3080.6%– 11.8%242327Renault3630.4%– 9.9%291,5260.4%– 18.0%272628Geely3240.4%new355120.1%new37 –29Skoda2800.3%– 41.1%271,3800.4%– 32.0%282830Ram2800.3%– 13.6%321,0480.3%– 23.2%313131KGM Ssangyong2630.3%– 43.0%301,3770.4%– 24.7%292732Chevrolet2490.3%– 31.2%311,2560.3%+ 0.1%302933Cupra2320.3%+ 36.5%281,0200.3%+ 36.2%323334Polestar2020.2%+ 102.0%365910.2%+ 31.9%363635Jeep 1890.2%– 10.0%347320.2%– 22.1%333236Fiat1420.2%– 20.2%336740.2%+ 31.1%343437JAC1250.1%new396500.2%new35 –38Genesis1200.1%– 11.1%384560.1%– 3.0%393739Peugeot1000.1%– 42.9%374730.1%– 29.3%383540Zeekr580.1%new402690.1%new40 –41Leapmotor560.1%new411940.1%new424842Jaguar520.1%– 8.8%422030.1%– 20.1%413843Alfa Romeo470.1%– 17.5%441660.0%– 37.4%433944Lamborghini210.0%+ 40.0%461030.0%+ 68.9%454145Maserati160.0%– 44.8%431040.0%– 20.0%444046Aston Martin160.0%+ 77.8%47710.0%+ 42.0%474547Ferrari130.0%+ 44.4%45710.0%+ 12.7%464248Bentley110.0%– 8.3%48430.0%– 25.9%484349Rolls-Royce110.0%+ 175.0%51300.0%+ 130.8%494950McLaren80.0%– 27.3%49280.0%+ 33.3%504751Lotus60.0%– 60.0%50220.0%– 70.3%514452Citroen00.0%– 100.0% –50.0%– 86.8%5246
Australia April 2025 – models:
PosModelApr-25%/24Mar2025%/24PosFY241Toyota Hilux4,1214.5%– 12.2%315,1203.9%– 12.0%332Ford Ranger4,0314.4%– 27.6%117,2574.5%– 19.1%213Toyota RAV43,8084.2%– 35.0%217,6104.5%+ 10.2%124Ford Everest2,2342.4%– 6.9%77,2201.9%+ 4.7%865Toyota Prado2,2332.4%+ 1198.3%510,6742.8%+ 215.6%4376Isuzu D-Max2,1072.3%– 11.5%88,3032.1%– 19.6%647Kia Sportage1,7011.9%+ 0.1%137,3011.9%+ 6.9%7108Toyota Corolla1,6601.8%– 20.8%186,3311.6%– 25.6%1279Nissan X-Trail1,6151.8%+ 32.5%126,1761.6%– 9.4%131610Mazda CX-51,6071.8%– 1.4%157,1451.8%+ 0.3%9811Hyundai Kona1,6051.8%+ 23.2%106,8061.8%+ 28.4%101712MG ZS1,5871.7%– 7.0%96,5391.7%– 18.2%11913GWM Haval Jolion1,4231.6%+ 29.2%175,5831.4%+ 22.4%162414Hyundai Tucson1,4101.5%– 8.9%146,1461.6%– 1.4%141215Mitsubishi Outlander1,3271.5%– 28.2%48,8072.3%– 1.0%5516BYD Shark 61,2931.4%new66,1291.6%new15 –17Isuzu MU-X1,2231.3%– 34.8%204,1421.1%– 38.5%221518Toyota Corolla Cross1,2021.3%+ 1.9%254,4131.1%+ 22.8%204219Chery Tiggo 4 Pro1,1651.3%new234,5031.2%new1911620Mazda BT-501,1511.3%+ 1.2%225,0191.3%– 1.2%1722
Source: VFACTS
More Stories
Why Jaecoo Cars Are Becoming Every Driver’s Favorite Premium SUV Choice
The premium SUV market has grown rapidly over the past few years as drivers seek vehicles that combine comfort, performance,...
Slate Electric Truck Pricing Confirmed at $26,400 as Custom Options Push Builds Much Higher Tipping $47K
When we first covered the Slate truck’s leaked pricing, the big takeaway was its surprisingly low projected $24,950 starting point....
Lucid Denies Bankruptcy and Take-Private Report After Stock Plunges on EV Maker Concerns
Lucid Group (Lucid Motors) moved quickly to reject a report claiming the EV maker was considering a take-private transaction or...
2027 Kia Seltos Is On Sale Now Starting at $24,990 With More Space, More Tech, and a Hybrid on the Way
When we first previewed the 2027 Kia Seltos, it was clear Kia was taking its small SUV well beyond a...
India First Half 2026: Maruti Suzuki DZire, Tata Punch and Nexon on top, record market up 18.6%
This content is for members only. Visit the site and log in/register to read.
India June 2026: Tata manages 1-2 with Punch and Nexon, Toyota Ebella lands
A facelift pushes the Tata Punch to its first win in 2 years. New vehicle wholesales in India soar 25.8%...