
Belgium January 2025: BMW breaks share record again in weak market (-13%)
BMW holds 14.8% of the Belgian new car market in January, a new record.
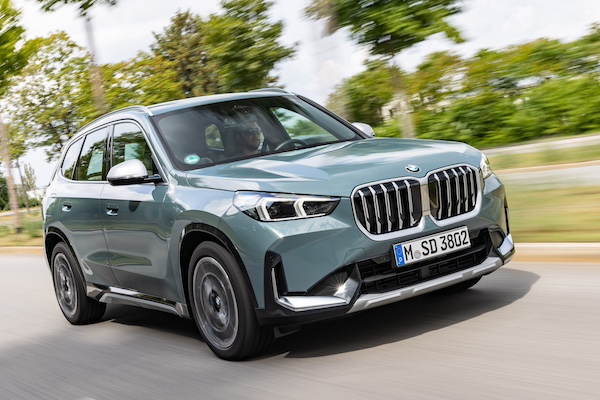
It’s a very slow start of the year for the Belgian new car market, off -13% year-on-year in January to 40,594 units. Note though that January 2024 was up 17.1% on the year prior. More than ever BMW (+10.3%) is the dominant force in Belgium, even reaching a record 14.8% share for the month. It eclipses its previous best of 14.6% reached last September. This is a level equivalent to the level Renault or Peugeot in neighbouring France. Although down year-on-year, Mercedes (-5%) posts a strong 9.1% share, up from 7% over the Full Year 2024. Reversely Volkswagen (+6.4%) and Dacia (+8.7%), although very solid year-on-year, each drop two spots on December to #3 and #4 respectively. Audi (-46.7%) is hit hard at #5 while Renault (+16.9%) is the only remaining Top 10 member in positive just as Volvo (-54.5%) disintegrate. Citroen (+49.5%) and Hyundai (+18.1%) shine below. Notice also Tesla off -44.8% to #15.
Previous post: Belgium Full Year 2024: BMW and X1 best-sellers again
One year ago: Belgium January 2024: BMW, Audi, Mercedes on top, market soars 17.1%
Full January 2025 Top 65 All brands ranking below.
Belgium January 2025 – brands:
PosBrandJan-25%/23DecFY241BMW5,99814.8%+ 10.3%312Mercedes3,6879.1%– 5.0%843Volkswagen3,6328.9%+ 6.4%124Dacia2,5236.2%+ 8.7%255Audi2,4406.0%– 46.7%736Toyota2,2405.5%– 14.1%977Renault2,2235.5%+ 16.9%488Peugeot1,8534.6%– 24.9%599Kia1,7604.3%– 2.4%111210Volvo1,4883.7%– 54.5%15611Hyundai1,3403.3%+ 18.1%141312Ford 1,3363.3%– 5.2%121513Skoda1,2733.1%– 35.4%101114Citroen1,1812.9%+ 49.5%131415Tesla1,0082.5%– 44.8%61016Nissan9742.4%– 2.6%181717Opel7271.8%– 16.4%161618Mini4551.1%– 3.0%171919Suzuki4531.1%– 24.8%242120Land Rover3800.9%– 53.8%252021Porsche3710.9%– 0.3%192322Cupra3610.9%– 4.0%272623Seat3300.8%– 31.4%262224Polestar3000.7%+ 115.8%202825MG2760.7%– 2.5%282426Mazda2540.6%– 59.4%231827BYD2470.6%+ 88.5%212728Fiat2020.5%– 31.5%222529Alfa Romeo1740.4%– 3.9%353430Lexus1500.4%+ 16.3%303131Honda1440.4%– 42.6%323032Jeep1320.3%– 42.9%292933DS900.2%+ 30.4%373334Xpeng860.2%+ 8500.0%334035SsangYong/KG Mobility840.2%– 35.4%363236Smart720.2%+ 28.6%343537Maxus550.1%+ 2650.0%464138Leapmotor520.1%new394939Lotus220.1%+ 22.2%313740Lancia200.0%new385141Ferrari190.0%+ 46.2%434242Alpine180.0%+ 0.0%474343Aston Martin160.0%+ 700.0%515044Subaru150.0%– 21.1%403945Bentley140.0%+ 7.7%495346Lynk & Co140.0%– 75.4% –3847Jaguar130.0%– 84.1%413648Maserati130.0%+ 18.2%454449BAIC130.0%+ 0.0%484750Tripod100.0%– 16.7%444551Dongfeng100.0%new – –52Lamborghini90.0%+ 0.0% –4853Forthing60.0%– 33.3%424654B-Style & Flex-I-Trans60.0%n/a –7255Allied Vehicles50.0%– 44.4%535456Omoda40.0%new –6657DFSK30.0%– 70.0%525258FAW30.0%+ 50.0%565759SWM20.0%+ 100.0%546160AMF20.0%n/a586861Rolls-Royce20.0%– 60.0% –5862NIO10.0%– 50.0%576363McLaren10.0%– 75.0% –5964Alpina10.0%+ 0.0% –6065Caterham10.0%n/a –71
Source: FEBIAC
More Stories
Unlock Hidden Performance: Why Modern Drivers Are Turning to Smart Tuning Solutions
Unlock Hidden Performance: Why Modern Drivers Are Turning to Smart Tuning Solutions For decades, car enthusiasts have searched for ways...
What Food Is Miami Known For? Dishes You Should Not Miss
Miami’s colorful cuisine is a real reflection of its diverse culture and history. The unique dishes, a combination of a...
2027 Chevrolet Corvette Grand Sport X Could Be the Real Sweet Spot in the Lineup
Back on March 13, 2001, Paul Pierce lit up the Lakers at Staples Center with 42 points on 13-of-19 shooting....
2026 Chevrolet Silverado EV Trail Boss Review & Test Drive
The electric vehicle (EV) market has leveled out for many reasons as of late, but such an environment hasn’t stopped...
Netherlands March 2026: Tesla manages 1-2, Kia EV5 in Top 10
The Kia EV5 ranks #8 for its 5th month in market. The Dutch new car market stabilises after two horrendous...
Italy March 2026: Leapmotor T03 on podium
The Leapmotor T03 becomes the first Chinese model to enter the Italian podium. New car sales in Italy are up...