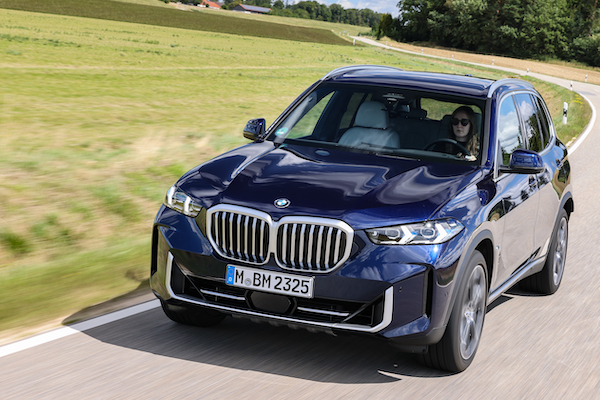
Belgium October 2024: BMW (+27.4%) at record heights, Dacia (+28.3%) shines
BMW held a record 14.6% of the Belgian market in September and 14.3% in October.
Note complete September data is also available in the data section of this article.
New car sales in Belgium fall -5.5% year-on-year in October to 36,447 units, with the year-to-date volume now off -4.9% to 393,015. After smashing its share record for the 2nd consecutive month in September at 14.6%, brand leader BMW (+27.4%) scores its 2nd best share in October at 14.3%. The German carmaker cements its YTD leadership with 11.4% of the market and sales up 4.8%. Volkswagen (+2.7%) and Mercedes (-10.8%) complete the podium like last month. Audi (-31.6%) is in freefall at #4 but all remaining Top 9 member defy the negative market with upticks. Dacia (+28.3%) is the most dynamic at #8, followed by Skoda (+16.9%), Peugeot (+6.9%), Renault (+5.4%) and Volvo (+4%). Chinese carmakers Leapmotor (#38), Livan (#53) and Omoda (#57) make their first appearance in the Belgian charts.
Previous post: Belgium August 2024: BMW breaks share record, Volvo up in sinking market (-20.3%)
One year ago: Belgium October 2023: Audi, Skoda, Volvo impress in euphoric market
Full September and October 2024 Top 64 All brands ranking below.
Belgium September 2024 – brands:
PosBrandSep-24%/23Aug2024%/23PosFY231BMW4,62614.6%+ 23.8%139,53011.1%+ 2.5%112Volkswagen3,25010.3%– 19.3%233,4619.4%– 6.6%223Mercedes2,2937.2%– 36.9%325,4897.1%– 7.3%444Tesla2,0136.4%+ 78.5%1016,6094.7%+ 37.7%9135Audi1,8545.9%– 34.1%426,9227.6%+ 3.6%336Renault1,7955.7%+ 13.9%617,4084.9%– 13.1%867Volvo1,5725.0%+ 9.5%820,4195.7%+ 25.1%588Skoda1,5444.9%– 9.7%1213,9403.9%– 1.9%12119Toyota1,5304.8%– 4.7%719,3655.4%+ 4.1%6710Peugeot1,4884.7%– 24.7%516,0364.5%– 34.3%10511Dacia1,2233.9%+ 13.5%1118,1965.1%+ 11.7%7912Kia1,1123.5%– 34.6%914,3734.0%– 3.2%111013Mini1,0863.4%+ 69.2%154,7151.3%– 27.4%201814Ford 8872.8%– 34.4%139,3562.6%– 32.0%151215Opel7982.5%– 37.9%147,6222.1%– 38.7%161516Hyundai7802.5%– 28.4%1910,1912.9%+ 17.6%131617Nissan4441.4%– 35.1%207,0662.0%– 7.3%171718Citroen4031.3%– 79.6%1710,1772.9%– 23.1%141419Porsche3161.0%+ 32.8%243,3150.9%+ 8.1%242620Polestar2880.9%+ 87.0%251,7380.5%+ 6.6%292821BYD2870.9%+ 523.9%231,7980.5%+ 350.6%273622Land Rover2580.8%– 39.4%184,8561.4%+ 1.6%192223Suzuki2520.8%– 43.8%274,3171.2%+ 21.3%222524Cupra2160.7%– 51.9%292,5530.7%– 24.1%262425Seat1860.6%– 62.4%264,3991.2%– 18.1%212026Jeep1780.6%– 57.3%211,7800.5%– 24.1%282727Lexus1720.5%+ 73.7%301,1330.3%+ 29.6%313428Mazda1700.5%– 74.4%165,5561.6%+ 3.6%181929Fiat1350.4%– 80.9%223,0520.9%– 38.5%252130MG870.3%– 78.1%343,8511.1%+ 18.7%232331SsangYong/KG Mobility650.2%– 28.6%369180.3%– 3.2%323332DS580.2%– 74.6%338950.3%– 59.8%332933Honda560.2%– 64.8%281,5450.4%+ 75.4%303134Smart550.2%+ 189.5%316170.2%+ 928.3%354235Lotus370.1%+ 32.1%352800.1%+ 263.6%383836Xpeng270.1%new371000.0%new447537Alfa Romeo230.1%– 84.9%327220.2%– 48.4%343038BAIC140.0%+ 180.0%43890.0%+ 71.2%464639Jaguar120.0%– 82.9%404250.1%– 45.9%363540Subaru90.0%– 71.9%382350.1%– 23.2%393741Ferrari90.0%+ 50.0%391260.0%+ 21.2%414342Forthing90.0%+ 800.0%55750.0%+ 7400.0%485543Aston Martin90.0%+ 200.0%45700.0%+ 62.8%494944Maserati80.0%– 33.3%411110.0%– 13.3%424045Maxus80.0%+ 300.0%46920.0%+ 666.7%455346Alpine60.0%– 60.0%441370.0%– 3.5%403947Lamborghini60.0%+ 200.0%47830.0%+ 53.7%474848Tripod40.0%– 20.0%421030.0%+ 106.0%434749Lancia40.0%new58190.0%new57 –50NIO30.0%+ 200.0% –130.0%+ 85.7%606351DFSK20.0%– 80.0%48530.0%– 55.5%514152Morgan20.0%+ 100.0%5490.0%+ 0.0%626153Lynk & Co10.0%– 97.5% –3170.1%– 75.5%373254Allied Vehicles10.0%– 85.7%50460.0%– 16.4%524555Rolls-Royce10.0%– 50.0%52200.0%+ 81.8%565856SWM10.0%– 66.7%5390.0%– 10.0%615657Ineos10.0%n/a –80.0%– 57.9%645258B-Style & Flex-I-Trans10.0%+ 0.0% –50.0%+ 400.0%667659AMF10.0%n/a –40.0%– 20.0%696760Caterham10.0%+ 0.0% –40.0%+ 100.0%7069
Belgium October 2024 – brands:
PosBrandOct-24%/23Sep2024%/23PosFY231BMW5,19914.3%+ 27.4%144,72911.4%+ 4.8%112Volkswagen3,3639.2%+ 2.7%236,8249.4%– 5.9%223Mercedes2,6847.4%– 10.8%328,1737.2%– 7.7%444Audi2,4556.7%– 31.6%529,3777.5%– 0.7%335Peugeot2,2916.3%+ 6.9%1018,3274.7%– 31.0%956Renault2,1065.8%+ 5.4%619,5145.0%– 11.4%867Skoda2,0525.6%+ 16.9%815,9924.1%+ 0.2%11118Dacia1,9905.5%+ 28.3%1120,1865.1%+ 13.2%799Volvo1,7304.7%+ 4.0%722,1495.6%+ 23.2%5810Toyota1,7024.7%– 1.1%921,0675.4%+ 3.7%6711Tesla1,3733.8%+ 24.4%417,9824.6%+ 36.5%101312Kia1,3573.7%– 12.2%1215,7304.0%– 4.0%121013Opel1,1873.3%+ 37.2%158,8092.2%– 33.8%161514Ford 1,0943.0%– 7.3%1410,4502.7%– 30.1%151215Nissan5921.6%– 21.2%177,6581.9%– 8.5%171716Hyundai5851.6%– 49.6%1610,7762.7%+ 9.7%131617Porsche5841.6%+ 40.4%193,8991.0%+ 11.9%242618Citroen5211.4%– 60.6%1810,6982.7%– 26.5%141419Mini3450.9%– 39.6%135,0601.3%– 28.4%201820Land Rover3340.9%– 1.5%225,1901.3%+ 1.4%192221Suzuki3160.9%– 27.0%234,6331.2%+ 16.1%222522BYD2730.7%+ 326.6%212,0710.5%+ 347.3%273623Seat2690.7%– 35.8%254,6681.2%– 19.4%212024Cupra2550.7%– 61.9%242,8080.7%– 30.4%262425Jeep2210.6%– 24.1%262,0010.5%– 24.1%282726Polestar2210.6%+ 0.5%201,9590.5%+ 5.9%292827Fiat1750.5%– 63.9%293,2270.8%– 40.7%252128Mazda1510.4%– 77.5%285,7071.5%– 5.4%181929Lexus1510.4%+ 25.8%271,2840.3%+ 29.2%313430MG1360.4%– 59.9%303,9871.0%+ 11.3%232331Honda1340.4%– 14.1%331,6790.4%+ 61.9%303132DS1010.3%– 39.9%329960.3%– 58.4%332933SsangYong/KG Mobility860.2%– 7.5%311,0040.3%– 3.6%323334Alfa Romeo650.2%– 45.4%377870.2%– 48.1%343035Smart500.1%+ 138.1%346670.2%+ 723.5%354236Lotus480.1%– 27.3%353280.1%+ 129.4%373837Xpeng380.1%new361380.0%new427538Leapmotor310.1%new –310.0%new55 –39Lancia230.1%new49420.0%new53 –40Forthing190.1%n/a42940.0%+ 9300.0%475541Jaguar180.0%– 69.5%394430.1%– 47.5%363542Tripod150.0%+ 150.0%481180.0%+ 110.7%444743Maserati140.0%+ 100.0%441250.0%– 7.4%434044Ferrari130.0%+ 0.0%411390.0%+ 18.8%414345DFSK90.0%+ 80.0%51620.0%– 50.0%504146Alpine80.0%– 33.3%461450.0%– 5.8%403947BAIC80.0%+ 300.0%38970.0%+ 79.6%464648Lamborghini80.0%+ 33.3%47910.0%+ 51.7%484849Aston Martin80.0%+ 166.7%43780.0%+ 69.6%494950Subaru70.0%– 72.0%402420.1%– 26.9%393751Maxus60.0%n/a45980.0%+ 716.7%455352Allied Vehicles50.0%– 44.4%54510.0%– 20.3%524553Livan50.0%new –50.0%new70 –54Morgan30.0%+ 200.0%52120.0%+ 20.0%626155Bentley20.0%– 71.4% –560.0%– 42.3%514456AMF20.0%+ 100.0%5960.0%+ 0.0%676757Omoda20.0%new –20.0%new75 –58Lynk & Co10.0%– 66.7%533180.1%– 75.5%383259Rolls-Royce10.0%+ 0.0%55210.0%+ 75.0%585860McLaren10.0%n/a –160.0%+ 60.0%605961SWM10.0%+ 0.0%56100.0%– 9.1%635662Ineos10.0%n/a5790.0%– 52.6%645263Caterham10.0%n/a6050.0%+ 150.0%696964KTM10.0%n/a –10.0%n/a83 –
Source: Febiac

