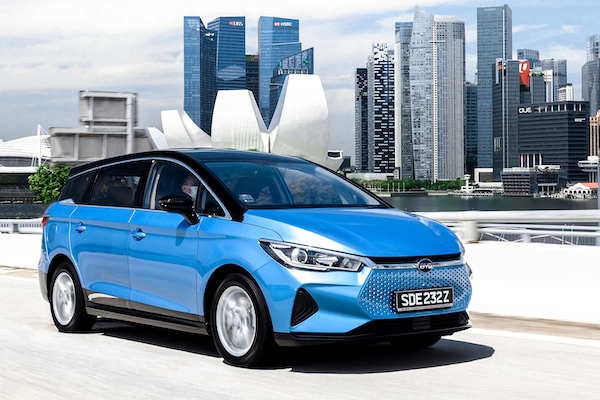
Singapore November 2023: BYD (+221.9%) stands out in market up 10%
BYD sales triple year-on-year in November
The Singaporean new car market climbs up a round 10% year-on-year in November to2,541 sales, meaning the year-to-date tally is down -10.8% to 25,451 after 11 months. Toyota (+43%) is in outstanding shape atop the brands charts with 22.6% share vs. 23% so far this year, it distances Mercedes (-24.1%) and BMW (-22.8%) both imploding. Once again BYD (+221.9%) is the best performer in the Top 10, hitting 9.2% share vs. 4.5% year-to-date where it ranks #5. All remaining Top 10 members bar Honda (-24.3%) and Nissan (+8.1%) manage to advance faster than the market: Mazda is the most dynamic at +63%, followed by Hyundai (+28.7%), Kia (+24.7%) and Audi (+19.7%).
Previous month: Singapore October 2023: Toyota, BYD ignore market edging down -1.8%
One year ago: Singapore November 2022: Mercedes overtakes Toyota to #1, ignores market off -22.4%
Full November 2023 Top 40 All brands ranking below.
Singapore November 2023 – brands:
PosBrandNov-23%/22Oct2023%/22PosFY221Toyota (incl Lexus)57522.6%+ 43.0%15,85523.0%– 1.4%112Mercedes35614.0%– 24.1%23,89515.3%– 20.9%223BMW2379.3%– 22.8%33,15012.4%– 4.1%334BYD2359.2%+ 221.9%51,1434.5%+ 62.4%5125Honda1907.5%– 24.3%42,1058.3%– 31.1%446Mazda1325.2%+ 63.0%69833.9%– 3.9%767Hyundai1305.1%+ 28.7%89123.6%– 40.2%858Nissan1074.2%+ 8.1%91,1114.4%+ 34.5%689Kia1064.2%+ 24.7%78523.3%+ 5.8%91010Audi732.9%+ 19.7%105572.2%– 28.2%11911Suzuki702.8%+ 536.4%193781.5%+ 164.3%142412Volkswagen351.4%+ 59.1%124271.7%– 1.8%131313MG321.3%+ 433.3%172491.0%– 3.9%181814Tesla281.1%– 67.1%117252.8%– 6.9%10715Porsche281.1%– 48.1%135162.0%– 33.1%121116Citroen281.1%+ 75.0%142881.1%– 13.3%161417Peugeot281.1%+ 7.7%202651.0%– 5.0%171718Skoda281.1%+ 133.3%162280.9%+ 44.3%192319Volvo240.9%– 36.8%153571.4%+ 17.8%151520SsangYong180.7%+ 800.0%34660.3%– 77.1%271621Great Wall180.7%n/a18390.2%n/a33 –22Mini150.6%– 31.8%231440.6%– 34.5%221923Land Rover90.4%+ 0.0%241600.6%– 5.9%212224Subaru60.2%– 40.0%221380.5%– 0.7%232625Maserati60.2%+ 0.0%27640.3%+ 12.3%283326Opel40.2%– 60.0%211980.8%– 4.8%202127Seat40.2%+ 33.3%33530.2%– 25.4%313228Jaguar40.2%– 42.9%28340.1%– 58.5%343129Polestar30.1%– 66.7%25920.4%– 38.7%262530Lamborghini30.1%+ 200.0% –110.0%– 50.0%393531Jeep20.1%– 33.3% –160.1%– 15.8%353632Maxus20.1%n/a3590.0%n/a40 –33Ferrari10.0%– 80.0%26950.4%+ 10.5%242934Lotus10.0%n/a29160.1%+ 700.0%365035Alfa Romeo10.0%– 50.0% –80.0%– 57.9%413836Fiat10.0%+ 0.0% –50.0%– 54.5%424037Datsun10.0%+ 0.0%3640.0%– 33.3%444238Rolls Royce00.0%– 100.0%30930.4%+ 8.1%253039Bentley00.0%– 100.0%31570.2%– 36.7%292840Mitsubishi00.0%– 100.0%32560.2%– 75.9%3020
Source: LTA


