New Zealand November 2023: Rentals keep Toyota RAV4 #1, MG breaks ranking record with MG 4 up to #6
The Toyota RAV4 is the best-selling vehicle in New Zealand in November.
The New Zealand new vehicle market continues to drift in November at -6.9% year-on-year to 14,520 units, meaning the year-to-date tally is now off -8.9% to 139,257. A very rare feat, Passenger Cars actually surge 19.6% year-on-year to 3,176 this month, with SUVs edging down -1.9% to 8,305 and Light Commercials imploding -41.1% to 2,164. Year-to-date, Passenger Cars are down -12.1% to 23,005, SUVs down -3.1% to 78,776 and Light Commercials off -21.5% to 29,929.
In the brands charts, Toyota (+33.4%) once again goes against the depleted market to score a very solid 24.9% share, to be compared with 21.9% year-to-date. Ford (-3.4%) this time limits its falls and manage 13% of the market vs. 11.1% so far this year. Mitsubishi (-29.2%) isn’t that lucky but returns to the third spot it holds year-to-date. MG (+91.1%) is up spectacularly to a record 4th place overall with 6.2% share vs. 4% YTD. Hyundai (+11.1%) is also up but Tesla (-58.4%), Kia (-43.6%) and Suzuki (-35.3%) all implode below. BYD (-9.1%) stays inside the Top 10 at #9 vs. #13 YTD.
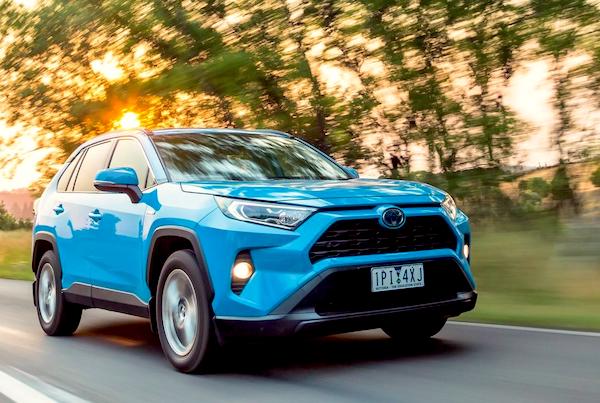
Over in the models aisle, the Toyota RAV4 (+148.1%) repeats at #1 however 68% of its volume has gone to rental companies this month. As a result the RAV4 climbs to #2 year-to-date, overtaking the Toyota Hilux (-54.6%) down to #7 in November. The Ford Ranger (-29.1%) is #2 again with a strong 7.5% share, it easily holds onto the YTD top spot just as rentals account for 28% of its total. The Tesla Model Y (-50.5%) is back inside the Top 20 at #4 but craters year-on-year. The Toyota Corolla (+120.5%) is young and pretty again mainly, here too, thanks to rentals at 75% of its volume. The MG 4 continues to climb up the ladder at a record #6.
Previous month: New Zealand October 2023: Rentals push Toyota up to highest share in 4 years, MG 4 up to #7
One year ago: New Zealand November 2022: Tesla Model 3 #2, BYD Atto 3 #6 in market back in negative (-4.3%)
Full November 2023 Top 67 All brands and Top 25 models below.
New Zealand November 2023 – brands:
PosBrandNov-23%/22Nov2023%/22PosFY221Toyota3,61424.9%+ 33.4%130,50721.9%+ 13.7%112Ford 1,89313.0%– 3.4%215,40811.1%+ 13.2%233Mitsubishi1,1598.0%– 29.2%412,4809.0%– 44.8%324MG8986.2%+ 91.1%55,5134.0%+ 13.4%795Hyundai6804.7%+ 11.1%67,1945.2%– 6.8%566Suzuki6024.1%– 35.3%76,5984.7%– 15.3%657Tesla5663.9%– 58.4%164,3473.1%– 24.0%878Kia4683.2%– 43.6%39,6756.9%– 12.3%449BYD4323.0%– 9.1%103,0732.2%+ 124.6%131910Nissan4132.8%– 29.6%94,2393.0%+ 4.1%91011Mazda3642.5%– 17.1%84,0072.9%– 30.6%10812Volkswagen2922.0%– 13.4%113,6962.7%+ 5.4%111213GWM2711.9%+ 774.2%148520.6%+ 50.5%273214Mercedes2401.7%+ 7.1%132,3681.7%– 14.7%141415Skoda2151.5%– 33.4%211,6671.2%– 19.7%181816Honda2031.4%– 38.1%123,1012.2%– 14.4%121117BMW1481.0%+ 1.4%171,6451.2%+ 5.4%192018Audi1451.0%+ 5.8%251,3311.0%– 11.0%202219LDV1431.0%– 24.3%291,0980.8%– 51.3%241620Mini1411.0%+ 291.7%199520.7%+ 24.9%262921Isuzu1401.0%– 31.7%152,2811.6%– 25.5%151322Lexus1290.9%+ 186.7%201,2090.9%+ 24.5%212523Fuso1220.8%– 2.4%181,1860.9%– 2.4%222424Fiat1130.8%+ 63.8%315270.4%– 32.3%322825Peugeot1040.7%– 9.6%229840.7%– 37.1%252126Subaru1020.7%– 50.7%231,8771.3%– 17.4%171527Jeep970.7%+ 340.9%344660.3%– 10.9%363528Polestar790.5%– 26.9%324790.3%– 39.7%333029Iveco740.5%+ 42.3%335500.4%+ 44.0%313730Land Rover730.5%+ 87.2%261,1710.8%– 9.9%232331Scania730.5%+ 30.4%306300.5%+ 30.4%293632Hino690.5%– 28.1%287300.5%– 18.4%282633SsangYong510.4%+ 54.5%514710.3%– 47.7%352734Porsche370.3%+ 42.3%274750.3%– 15.3%343335Cupra370.3%– 24.5%244260.3%+ 33.5%374036Volvo360.2%– 52.6%365650.4%– 24.0%303137Opel350.2%+ 45.8%353230.2%+ 509.4%385238Volvo Trucks300.2%+ 20.0%373050.2%+ 73.3%404639UD Trucks250.2%– 28.6%393000.2%+ 9.5%414140DAF250.2%+ 127.3%472320.2%+ 60.0%444941Kenworth230.2%+ 27.8%411920.1%– 14.3%464542Chevrolet180.1%– 56.1%382200.2%– 17.9%454243Ram170.1%– 45.2%452520.2%– 35.7%433944Jaguar150.1%+ 15.4%481700.1%– 57.3%483845Mahindra140.1%+ 250.0%432990.2%+ 75.9%424846Renault130.1%– 58.1%403150.2%– 39.4%393447MAN110.1%– 26.7%491420.1%– 19.8%504748Citroen100.1%– 28.6%441700.1%– 38.8%474349Foton90.1%– 50.0%461680.1%– 34.9%494450Haval80.1%– 95.4%421,8841.4%– 12.2%161751Mack40.0%– 20.0%59440.0%+ 69.2%576152Can-Am40.0%– 50.0%50400.0%– 38.5%605353Ferrari30.0%– 25.0%60420.0%+ 55.6%596254Ineos20.0%new52600.0%new51 –55Alfa Romeo20.0%– 33.3%57560.0%– 34.9%525156Maserati20.0%– 50.0%55560.0%– 6.7%535457Bentley20.0%+ 100.0%58470.0%+ 6.8%555958Lamborghini20.0%#DIV/0!62250.0%– 3.8%626059Yamaha20.0%– 33.3%53250.0%– 40.5%635860BCI20.0%n/a –80.0%+ 166.7%707661Morgan20.0%n/a –40.0%+ 0.0%747162Aston Martin10.0%– 75.0% –440.0%+ 0.0%565663CRRC10.0%new –430.0%new58 –64Lotus10.0%n/a61290.0%+ 52.6%616565International10.0%+ 0.0%54220.0%+ 10.0%646466Western Star10.0%– 50.0%64170.0%+ 30.8%656967Rolls-Royce10.0%+ 0.0%65130.0%– 23.5%6766
New Zealand November 2023 – models:
PosModelNov-23%/22Oct2023%/22PosFY221Toyota RAV41,4199.8%+ 148.1%18,3196.0%+ 48.6%252Ford Ranger 1,0837.5%– 29.1%29,7097.0%– 7.2%113Mitsubishi Outlander5583.8%– 6.8%43,7012.7%– 57.8%534Tesla Model Y5443.7%– 50.5%n/a3,5782.6%+ 6.6%665Toyota Corolla4853.3%+ 120.5%162,1531.5%– 13.5%11126MG 44693.2%new7n/an/anewn/an/a7Toyota Hilux4202.9%– 54.6%37,9495.7%– 13.4%328Mitsubishi Eclipse Cross3772.6%+ 53.9%83,3742.4%– 0.8%789Toyota Corolla Cross3702.5%n/a51,7121.2%n/a19n/a10Suzuki Swift3502.4%– 20.1%123,7032.7%+ 3.8%4711BYD Atto 33382.3%– 28.8%102,7422.0%+ 100.4%10n/a12Nissan Qashqai2711.9%n/an/an/an/an/an/an/a13Toyota Yaris Cross2651.8%+ 25.0%61,9521.4%+ 10.5%131914Ford Everest2511.7%+ 5.9%131,7821.3%#VALUE!16n/a15Hyundai i30 2501.7%n/a17n/an/an/an/an/a16MG HS2471.7%n/an/an/an/an/an/an/a17Hyundai Kona1891.3%+ 47.7%n/a1,7661.3%– 25.1%171418Mazda CX-51721.2%+ 0.0%181,5661.1%– 28.4%211619Kia Sportage1721.2%– 42.3%19n/an/an/an/a1120Toyota Hiace1691.2%+ 70.7%221,7871.3%+ 16.6%15n/a21MG ZS1661.1%– 53.9%142,9852.1%+ 0.0%9922Nissan Leaf1651.1%n/a20n/an/an/an/an/a23Toyota Camry1611.1%n/a21n/an/an/an/an/a24Honda Jazz1601.1%– 28.3%231,7481.3%– 22.6%1815n/aMercedes Sprinter1060.7%+ 15.2%n/a7390.5%+ 3.9%n/an/an/aMitsubishi Triton910.6%– 70.9%n/a3,0772.2%– 47.5%84n/aHyundai Tucson790.5%n/an/a1,9041.4%n/a14n/an/aKia Niro760.5%n/a91,9761.4%n/a12n/an/aIsuzu D-Max430.3%– 44.2%n/a1,0110.7%– 41.4%n/a20n/aNissan Navara360.2%– 75.5%n/a1,1400.8%– 39.7%n/a18
Source: MIA, Autotalk

