Brazil November 2023: Hyundai (+27.2%), BYD (#12) shine, volumes up just 5.1%
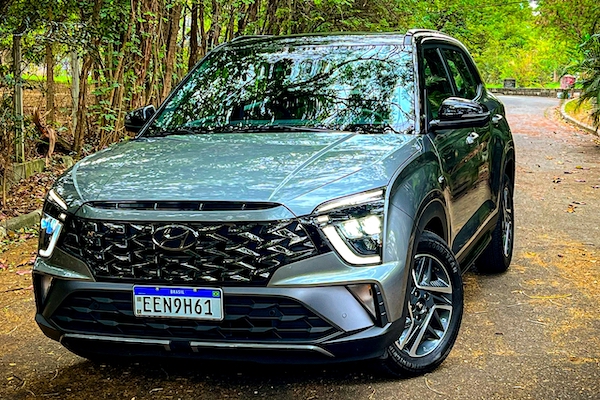
The Hyundai Creta breaks its monthly volume record in November.
201,649 new light vehicles hit Brazilian roads in November, a 5.1% year-on-year improvement. The year-to-date volume is now up 10.7% or 187,000 units to 1,942,792. Fiat (-1.5%) goes against the positive market but still manages a very solid 22% share vs. 10.8% at home in Italy. Volkswagen (+1.2%) edges up to 14.9% share, confirming it is now avocet Chevrolet (-0.1%). Hyundai (+27.2%) delivers the largest year-on-year gain in the Top 7, climbing to #4 and 10.2% share vs. #5 and 8.5% year-to-date. Nissan (+52.9%) and Chery (+51.5%) are even more impressive in the remainder of the Top 10 while Honda (+3.4%) is muted and Toyota (-15.4%), Jeep (-11.8%) and Renault (-9.7%) struggle. BYD continues to surge ahead, smashing all its records at #12 with 3,622 sales and 1.8% share. It started at 0.2% share back in May. Ram (+377.9%) also posts a surreal year-on-year lift, with Porsche (+57.3%), Ford (+55.2%), Volvo (+51.3%), Land Rover (+43.6%), BMW (+40%) and Audi (+39.6%) strong below.
The Fiat Strada (+24.7%) remains the most popular vehicle in the country with 5.7% of the market, distancing the VW Polo (+373.8%) at 5.1%. The Hyundai HB20 (+6.3%) climbs up two spots on October to #3, passing the Chevrolet Onix (+32.6%). The Hyundai Creta (+32.6%) breaks its volume record just under 7,000 sales and reaches its highest ranking since last February at #5. The VW T-Cross (+26.1%) is also in great shape at #6 but the rest of the Top 13 is in freefall, with the Chevrolet Onix Plus (-32.5%), Fiat Argo (-31%) and Mobi (-27%) hit the hardest. The Ram Rampage continues to gear up, passing the 3,000 monthly sales milestone and breaking into the Top 30 at #27. The Chery Tiggo 5X (#30) wins the Chinese race ahead of the BYD Dolphin (#38), BYD Song Plus (#41) and GWM Haval H6 (#44).
Previous month: Brazil October 2023: Rampage lifts Ram up 474.1%
One year ago: Brazil November 2022: 46.4% places 3 models in Top 5, Hyundai HB20 #1 again
Full November 2023 Top 20 brands and Top 135 models below.
Brazil November 2023 – brands:
PosBrandNov-23%/22Oct2023%/22PosFY221Fiat 44,26922.0%– 1.5%1428,71222.1%+ 10.4%112Volkswagen30,11914.9%+ 1.2%2301,42815.5%+ 27.8%233Chevrolet27,03713.4%– 0.1%3295,61515.2%+ 14.2%324Hyundai 20,56710.2%+ 27.2%5164,9368.5%– 3.7%555Toyota 14,8027.3%– 15.4%4171,9738.9%+ 0.8%446Renault 11,9155.9%– 9.7%6111,1385.7%– 3.3%777Jeep11,7465.8%– 11.8%7118,4316.1%– 4.3%668Nissan5,9773.0%+ 52.9%865,1453.4%+ 34.1%999Honda5,6202.8%+ 3.4%965,4553.4%+ 29.2%8810Chery4,1622.1%+ 51.5%1027,3911.4%– 16.0%121111Citroen 3,7621.9%– 13.8%1329,6841.5%+ 6.2%111212BYD3,6221.8%n/a1512,4410.6%n/a17n/a13Ram3,4411.7%+ 377.9%1413,8500.7%+ 242.3%152014Peugeot3,3961.7%– 26.6%1231,5531.6%– 19.6%101015Ford 2,8801.4%+ 55.2%1125,3941.3%+ 38.3%131416Mitsubishi1,8540.9%– 3.2%1616,0130.8%– 21.4%141317BMW1,5010.7%+ 40.0%1813,3600.7%+ 6.8%161518GWM1,3560.7%new178,6830.4%new18 –19Volvo7260.4%+ 51.3%197,1190.4%+ 58.7%191920Audi6030.3%+ 39.6%205,6250.3%+ 21.7%201721Porsche3980.2%+ 57.3%224,7900.2%+ 63.8%222222Land Rover3590.2%+ 43.6%234,3900.2%+ 32.2%2321n/aMercedes2660.1%– 54.4%245,0420.3%– 10.0%2116
Brazil November 2023 – models:
PosModelNov-23%/22Oct2023%/22PosFY221Fiat Strada11,5185.7%+ 24.7%1110,0285.7%+ 6.5%112VW Polo 10,1975.1%+ 373.8%293,2464.8%+ 1657.4%2523Hyundai HB2010,0575.0%+ 6.3%579,2784.1%– 11.2%424Chevrolet Onix9,8024.9%+ 32.6%391,2044.7%+ 20.4%335Hyundai Creta6,9893.5%+ 32.6%1157,2402.9%+ 2.1%10116VW T-Cross6,5253.2%+ 26.1%764,6503.3%+ 9.3%787Fiat Mobi6,3673.2%– 27.0%466,0333.4%+ 0.8%658Renault Kwid5,9723.0%– 3.4%955,2132.8%+ 5.6%11129Chevrolet Tracker5,8992.9%– 18.4%859,8773.1%– 4.2%9710Jeep Compass5,7512.9%– 10.3%1555,1712.8%– 4.0%121011Fiat Cronos5,5722.8%– 15.3%1444,4232.3%+ 19.8%161912Chevrolet Onix Plus5,4232.7%– 32.5%668,5163.5%+ 1.9%5413Fiat Argo5,3352.6%– 31.0%1261,5003.2%+ 7.4%8914Fiat Pulse4,7192.3%+ 28.1%1741,2712.1%– 11.2%211415VW Nivus4,4212.2%– 9.0%1346,4572.4%+ 33.9%142016Fiat Toro4,4182.2%+ 27.2%1846,5972.4%+ 2.9%131517Jeep Renegade4,2362.1%– 5.3%2544,1572.3%– 4.0%171318Nissan Kicks4,1892.1%+ 60.7%1045,9582.4%+ 30.1%152119Honda HR-V3,9241.9%+ 35.1%1943,8532.3%+ 259.3%183720Toyota Hilux3,7831.9%– 21.4%2041,8562.2%– 2.3%191621Fiat Fastback3,7091.8%+ 16.3%2336,4551.9%+ 462.6%244722Toyota Corolla3,5711.8%– 2.3%2138,8762.0%+ 0.8%221723Hyundai HB20S3,3451.7%+ 136.9%2427,2461.4%+ 20.7%262624Citroen C33,3071.6%+ 3.6%3024,5591.3%+ 224.7%284225Renault Duster3,2951.6%+ 46.8%2823,3311.2%+ 14.2%302826VW Saveiro3,0951.5%+ 4.0%1641,3172.1%+ 102.6%202727Ram Rampage3,0261.5%new326,1470.3%new53 –28Peugeot 2082,9101.4%– 26.8%2925,9941.3%– 7.6%272329Toyota Corolla Cross2,6481.3%– 22.2%2237,6811.9%– 2.4%231830Chery Tiggo 5X2,4331.2%+ 106.7%3312,1750.6%+ 35.8%404831VW Virtus2,4311.2%+ 305.2%2723,4651.2%+ 385.8%295532Chevrolet Montana2,2631.1%n/a2627,5361.4%n/a25n/a33Fiat Fiorino2,1941.1%+ 3.9%3618,3790.9%– 2.9%353134Ford Ranger2,1411.1%+ 66.7%3117,9020.9%+ 40.9%363835VW Taos1,8630.9%+ 62.1%3814,2250.7%+ 38.9%384136Jeep Commander1,7360.9%– 28.3%4018,6901.0%– 6.9%332937Toyota Yaris Sedan1,7340.9%+ 7.4%3417,8700.9%+ 29.7%373638BYD Dolphin1,6940.8%new434,5610.2%new56 –39Chevrolet Spin1,6300.8%– 14.3%3518,5001.0%+ 20.3%343340Toyota Hilux SW41,5440.8%+ 1.4%4114,0840.7%+ 14.1%393941BYD Song Plus1,5230.8%new455,7870.3%new54 –42Toyota Yaris Hatch1,4050.7%– 40.6%3920,5771.1%– 12.0%322543Chevrolet S101,3730.7%– 2.2%3722,8351.2%– 3.9%312444GWM Haval H61,2950.6%new428,6190.4%new46 –45Mitsubishi L2001,1520.6%– 8.0%4410,8370.6%– 23.9%433546Chery Tiggo 81,0570.5%+ 36.2%528,3900.4%– 13.7%474447VW Amarok9320.5%+ 20.4%507,2800.4%+ 42.0%505348Renault Oroch8910.4%– 36.8%4611,3750.6%+ 5.0%414049Honda City8870.4%– 22.7%4910,9110.6%– 47.6%423050Renault Master7740.4%+ 2.4%479,4780.5%+ 3.8%454651Nissan Versa7720.4%+ 489.3%487,8350.4%+ 51.3%485452Nissan Frontier6890.3%– 37.8%537,3640.4%– 4.7%495053Honda City Hatch6620.3%– 52.1%519,9890.5%– 31.6%443454Chery Tiggo 76000.3%– 10.7%545,6730.3%– 29.1%554955Mitsubishi Eclipse Cross5390.3%+ 13.2%563,3340.2%– 3.1%645956Renault Sandero5240.3%– 60.9%577,1020.4%– 23.7%514357BMW X13820.2%+ 416.2%593,5430.2%+ 2.7%626258Renault Logan3500.2%– 71.0%734,1440.2%– 55.9%574559Chevrolet Equinox3500.2%+ 21.5%583,7070.2%+ 162.5%617760VW Tiguan3340.2%n/an/an/an/an/an/an/a61Nissan Sentra3260.2%n/a553,7620.2%n/a60n/a62BYD Yuan Plus2860.1%new691,2810.1%new87n/a63VW Jetta2800.1%+ 330.8%621,9520.1%+ 277.6%7110964BMW 320i2560.1%– 61.6%643,9840.2%– 4.3%585765Peugeot Expert2540.1%+ 63.9%701,7760.1%– 47.5%746166Ford Transit2410.1%– 12.0%792,4200.1%+ 60.2%677167Citroen C4 Cactus2320.1%– 76.9%603,4140.2%– 80.7%633268Volvo XC602280.1%+ 109.2%613,8370.2%+ 144.4%597569Fiat Scudo2180.1%+ 24.6%633,1880.2%+ 300.0%659370Kia K25002130.1%– 19.9%672,2160.1%– 10.0%686671Fiat Ducato2110.1%+ 2537.5%877080.0%– 61.5%1047672Volvo XC402070.1%– 19.5%811,4860.1%– 7.5%837473Audi Q32040.1%– 4.2%801,4840.1%+ 9.6%847874Audi Q51930.1%+ 99.0%661,8580.1%+ 37.0%728075BMW X51770.1%+ 1670.0%n/a1,0400.1%+ 8.3%949476Ford Bronco1700.1%+ 17.2%651,0170.1%– 31.7%957977Mitsubishi Pajero1630.1%– 12.4%721,8300.1%+ 13.9%737378Citroen Jumpy1620.1%– 3.0%961,5820.1%– 39.1%786579VW/MAN Express1610.1%+ 43.8%781,7040.1%– 13.8%757080Ford Maverick1590.1%+ 156.5%711,4990.1%+ 19.5%818581Ram Classic1490.1%– 28.0%761,9730.1%+ 695.6%7010882BMW X41480.1%n/a921,0500.1%n/a939983Chevrolet Trailblazer1370.1%– 59.3%681,5700.1%– 46.1%796384Volvo XC901300.1%n/a991,0690.1%n/a92n/a85Ram 25001240.1%+ 300.0%771,4910.1%+ 64.2%829286Land Rover Discovery1200.1%+ 122.2%901,4710.1%+ 10.2%858287Iveco Daily 1190.1%– 14.4%851,6310.1%+ 93.5%769688Ram 35001170.1%– 61.5%752,9850.2%+ 70.4%666889Peugeot 20081090.1%– 48.1%831,6140.1%– 67.3%775690Porsche 9111080.1%+ 125.0%829380.0%+ 66.3%9910591Chevrolet Cruze Sedan1060.1%– 71.4%841,1030.1%– 86.8%915192Porsche Macan980.0%+ 34.2%951,2050.1%+ 20.9%899193Mini Cooper900.0%+ 8.4%917220.0%+ 8.1%10310094Peugeot Partner890.0%– 51.6%931,5120.1%– 21.2%806995BYD Seal810.0%new1301830.0%new133 –96Porsche Panamera780.0%+ 457.1%1024530.0%+ 123.2%11313197Effa V21750.0%+ 0.0%948030.0%+ 21.5%10210198Hyundai HR650.0%+ 2066.7%1241580.0%– 75.4%13610499Ford F-150610.0%+ 1425.0%979390.0%+ 5116.7%98n/a100Audi A5570.0%+ 128.0%1035170.0%+ 92.9%111119101Mercedes Sprinter 315560.0%– 49.1%881,2010.1%+ 232.7%90115102Chery Arrizo 6540.0%– 23.9%899500.0%– 29.5%9781103Renault Kangoo E-Tech490.0%newn/a530.0%new159 –104Ford Territory430.0%– 20.4%749990.1%+ 7.9%9695105JAC E-JS1430.0%+ 16.2%1164150.0%– 29.7%114106106Chevrolet Cruze Hatch400.0%– 48.7%1103800.0%– 71.5%11584107Iveco Daily 30-130400.0%+ 300.0%1202020.0%– 55.5%132113108Audi A3380.0%n/a1073620.0%n/a116135109Porsche Cayenne350.0%n/a1041,4300.1%n/a86n/a110Audi A3 Sedan330.0%+ 450.0%1005980.0%+ 51.0%108110111Porsche Taycan320.0%+ 357.1%1152790.0%+ 19.7%124127112Hyundai Ioniq310.0%n/a1142590.0%+ 7.9%127128113BMW M2270.0%n/an/a460.0%n/a164n/a114Porsche Boxster260.0%n/a1092690.0%n/a125146115Ram 1500250.0%– 86.0%1051,2540.1%+ 10.2%8886116Audi A4250.0%– 13.8%1262960.0%+ 60.9%123124117Ford Mustang240.0%+ 33.3%1193440.0%+ 7.5%118122118Effa V22240.0%– 29.4%1213230.0%+ 29.7%121125119BMW 330E200.0%– 20.0%1065530.0%+ 2.0%110107120Porsche Cayman200.0%+ 1900.0%1082040.0%+ 397.6%131n/a121BMW 420i190.0%+ 35.7%1251090.0%+ 2.8%140138122BMW M3170.0%+ 112.5%1232590.0%+ 75.0%126134123Jeep Gladiator160.0%+ 100.0%1112230.0%+ 79.8%128140124BMW i4150.0%new1321460.0%new138n/a125VW Gol140.0%– 99.8%1176,1670.3%– 90.3%526126Mercedes Sprinter 417140.0%n/an/a470.0%n/a163n/a127Honda Civic130.0%+ 1200.0%1124560.0%– 77.1%11272128Mercedes CLA35130.0%+ 333.3% –590.0%– 20.3%156148129Mercedes C Class120.0%– 87.5%1016650.0%– 32.6%10788130Mercedes Sprinter 517120.0%new128770.0%new146 –131JAC EJV5.5120.0%new134510.0%new161 –132Jaguar F-Type100.0%+ 66.7%122930.0%+ 52.5%141n/a133Honda Accord100.0%n/a113520.0%n/a160n/a134BMW 530E90.0%– 25.0%n/a870.0%– 20.2%142142135VW Fusca90.0%+ 125.0%133850.0%+ 51.8%143n/a
Source: Fenabrave


