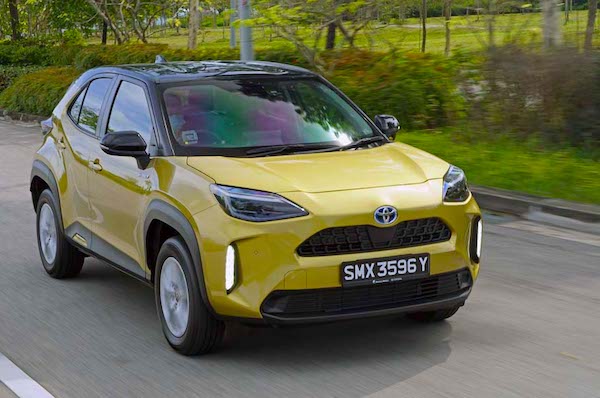
Singapore October 2023: Toyota (+35.2%), BYD (+46.3%) ignore market edging down -1.8%
Toyota holds 27% of the Singaporean market in October.
New car sales in Singapore edge down -1.8% year-on-year to 2,352 units, with a year-to-date tally now down -12.6% to 22,910. These are particularly weak results given the fact October 2022 was already down -19.4% on the year prior and the YTD 2022 total was off -33.8% on 2021. The reason behind such a low market lie with the surging prices of COE (Certificates of Entitlement) which is a permit to drive your vehicle and can account for up to the same price as the car! Toyota (+35.2%) bucks the negative trend atop the brands charts and grows to 27.1% share vs. 23% so far this year. Mercedes (-18.5%) and Honda (-26.5%) both fall much faster than the market where BMW (+2.6%) manages a small uptick. As it has been the case for the best part of a year now, BYD (+46.3%) vastly outpaces the market to repeat at #5 with 6.7% share vs. 4% year-to-date. Tesla (+45%), Volkswagen (+38.1%) and Mazda (+12%) also stand out.
Previous month: Singapore September 2023: BYD, Nissan, Toyota stand out in market edging up 2.3%
One year ago: Singapore October 2022: BYD up to record #5 in market down -19.4%
Full October 2023 Top 40 All brands ranking below.
Singapore October 2023 – brands:
PosBrandOct-23%/22Sep2023%/22PosFY221Toyota (incl Lexus)63727.1%+ 35.2%15,28023.0%– 4.6%112Mercedes33914.4%– 18.5%23,53915.4%– 20.6%223BMW27511.7%+ 2.6%32,91312.7%– 2.2%334Honda1647.0%– 26.5%41,9158.4%– 31.7%445BYD1586.7%+ 46.3%59084.0%+ 43.9%6126Mazda1124.8%+ 12.0%88513.7%– 9.7%767Kia763.2%– 20.0%97463.3%+ 3.6%9108Hyundai703.0%– 20.5%67823.4%– 45.1%859Nissan682.9%– 1.4%71,0044.4%+ 38.1%5810Audi642.7%– 27.3%154842.1%– 32.3%12911Tesla582.5%+ 45.0%106973.0%+ 0.4%10712Volkswagen582.5%+ 38.1%123921.7%– 5.1%131313Porsche482.0%– 7.7%114882.1%– 31.9%111114Citroen291.2%+ 11.5%192601.1%– 17.7%161415Volvo281.2%+ 21.7%143331.5%+ 25.7%141516Skoda281.2%+ 100.0%162000.9%+ 37.0%192317MG200.9%– 45.9%172170.9%– 14.2%181818Great Wall190.8%new –210.1%new34 –19Suzuki170.7%+ 54.5%133081.3%+ 133.3%152420Peugeot110.5%– 64.5%182371.0%– 6.3%171721Opel110.5%– 85.5%211940.8%– 2.0%202122Subaru110.5%+ 22.2%311320.6%+ 2.3%222623Mini100.4%– 52.4%221290.6%– 34.8%231924Land Rover90.4%– 55.0%201510.7%– 6.2%212225Polestar70.3%– 50.0%27890.4%– 36.9%262526Ferrari60.3%+ 20.0%25940.4%+ 16.0%242927Maserati40.2%+ 33.3%24580.3%+ 13.7%273328Jaguar20.1%– 75.0%23300.1%– 60.0%333129Lotus20.1%n/a34150.1%+ 650.0%365030Rolls Royce10.0%– 66.7%32930.4%+ 19.2%253031Bentley10.0%– 83.3%33570.2%– 34.5%282832Mitsubishi10.0%– 90.9%28560.2%– 75.3%292033Seat10.0%– 75.0% –490.2%– 27.9%303234SsangYong10.0%n/a –480.2%– 83.2%311635Maxus10.0%new2670.0%new41 –36Datsun10.0%n/a –30.0%– 40.0%444237Alpine10.0%+ 0.0% –20.0%– 71.4%454138Buick10.0%n/a –10.0%n/a47 –39Daimler10.0%n/a –10.0%n/a56 –40Lancia10.0%n/a –10.0%n/a57 –
Source: LTA


