Chile October 2023: Kia (+25.4%), Suzuki (+77.7%) stand out in market slowing down its fall
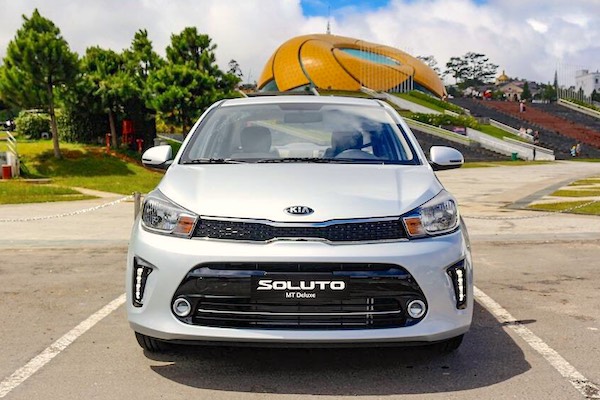
Kia Soluto sales triple year-on-year in October.
New light vehicle sales in Chile slow down their fall in October at a still searing -12.5% to 25,053 units, the smallest year-on-year drop since last March. The year-to-date volume however is devastated at -28% to just 261,132, a loss of exactly 100,000 sales compared to the first 10 months of 2022. Passenger Cars fare best for once this month at -0.4% to 5,844 with SUVs dropping -11.2% to 11,471, pickups off -23.2% to 5,349 and vans down -17.4% to 2,389.
Toyota (-18.2%) remains the best-selling carmaker in the country despite falling faster than the market to 8.4% share, identical to its YTD level. Kia (+25.4%) ignores the market gloom and gains four spots on September to land at #2. Suzuki (+77.7%) also generates a fantastic lift and repeats at #5 while Ford (+9.2%) is also in positive at #7. Hyundai (-6.4%) limits its fall and Nissan (-12.6%) matches the market but Chevrolet (-43.7%), MG (-39%), Maxus (-31.2%) and Peugeot (-17.9%) all sink. Below, Mazda (+84.2%), Citroen (+55.7%) and Great Wall (+47%) stand out. As a whole Chinese manufacturers hold 28.3% share and see their sales fall -20.2% year-on-year.
Model-wise, the Toyota Hilux (+7.8%) reclaims the top spot it holds year-to-date with a dominant 3.3% share. It distances the Kia Soluto (+194.8%) skyrocketing up 21 spots on last month to #2. Leader in September, the Great Wall Poer (+42.7%) still manages a fantastic third place ahead of the Suzuki Baleno and Chevrolet Groove (-26.1%) aka Baojun 510, still the best-selling SUV in Chile. The Suzuki Swift (+104.8%) is up 21 ranks on September to #7 and the Hyundai Grand i10 (+30.1%) up four to #10.
Previous month: Chile September 2023: Great Wall Poer signs first ever win, sales sink -30.5%
One year ago: Chile October 2022: Peugeot (+74.5%) impresses, Maxus T60 #1, sales down -25.7%
Full October 2023 Top 65 All brands and Top 30 models below.
Chile October 2023 – brands:
PosBrandOct-23%/22Sep2023%/22PosFY221Toyota 2,1108.4%– 18.2%122,0088.4%– 20.7%122Kia 1,8797.5%+ 25.4%614,8705.7%– 11.8%483Hyundai 1,7266.9%– 6.4%217,0656.5%– 14.3%344Chevrolet 1,5956.4%– 43.7%317,6656.8%– 45.5%215Suzuki1,5516.2%+ 77.7%514,3255.5%– 23.2%656Peugeot 1,3975.6%– 17.9%714,6345.6%– 14.8%577Ford 1,1924.8%+ 9.2%810,7074.1%– 3.3%8148Nissan9473.8%– 12.6%412,6664.9%– 2.2%7119MG9053.6%– 39.0%99,6953.7%– 45.8%9610Maxus8703.5%– 31.2%158,2383.2%– 36.5%111211Mazda7352.9%+ 84.2%128,1093.1%+ 60.4%131912Mitsubishi6942.8%– 42.1%219,0563.5%– 33.7%101313Citroen6882.7%+ 55.7%105,9232.3%– 2.3%182014ChangAn6812.7%– 35.3%167,4552.9%– 53.5%14915Great Wall6692.7%+ 47.0%116,7452.6%– 12.0%171616Volkswagen6432.6%– 14.4%186,8172.6%– 54.9%161017Chery5712.3%– 48.8%138,2273.2%– 62.1%12318Haval5712.3%+ 178.5%145,1562.0%+ 30.7%192319JAC5532.2%– 27.3%207,1902.8%– 30.3%151520DongFeng (DFSK+DFM)4621.8%– 35.2%244,0081.5%– 46.2%221721Subaru4361.7%+ 14.4%174,9331.9%+ 40.7%202522Ram3511.4%– 45.3%224,7031.8%– 30.6%211823Opel3231.3%– 6.4%193,3631.3%– 7.4%232624Foton2981.2%+ 8.0%282,7901.1%– 19.3%252725Jetour2671.1%+ 190.2%251,8050.7%+ 1.2%313726JMC2340.9%– 18.2%361,7910.7%– 54.5%322427Honda2300.9%– 8.4%232,0050.8%– 46.1%292828SsangYong2280.9%– 37.4%273,0511.2%– 16.2%242229Maple2000.8%newn/a2610.1%new52 –30Mercedes1970.8%– 11.3%302,0490.8%– 25.1%283031GAC Motor1560.6%– 18.3%311,7230.7%– 14.5%333432Renault 1480.6%– 56.5%262,6231.0%– 55.5%262133BAIC1470.6%+ 93.4%341,4230.5%+ 4.6%353834BMW1460.6%– 20.2%292,1350.8%– 16.6%273235Mahindra1180.5%+ 195.0%356940.3%– 39.1%424036Geely1000.4%– 69.5%321,9670.8%– 35.2%302937Jeep940.4%– 46.3%331,2570.5%– 56.7%363138Audi920.4%– 11.5%379390.4%– 23.7%373939Volvo880.4%+ 10.0%388420.3%– 14.3%394140Kaiyi790.3%new396100.2%new46 –41Skoda720.3%+ 44.0%466200.2%+ 1.8%454442Karry640.3%+ 3.2%478140.3%– 8.0%414243KYC610.2%– 53.8%418390.3%– 58.5%403644Exeed570.2%– 49.1%426280.2%+ 88.0%434745Cupra550.2%+ 450.0%455690.2%+ 216.1%475046Fiat400.2%– 66.4%449280.4%– 53.2%383547Mini370.1%+ 76.2%483120.1%+ 26.3%504948BYD340.1%new501530.1%new57–49Seat320.1%– 67.7%514700.2%– 23.8%484350Shineray310.1%n/a –400.0%n/a61 –51Lexus300.1%+ 30.4%432700.1%+ 26.8%515352Brilliance270.1%– 70.7%401,5430.6%– 32.4%343353ZNA260.1%– 40.9%536220.2%+ 8.4%444554Land Rover210.1%+ 31.3%522190.1%+ 72.4%555455Porsche190.1%– 20.8%492360.1%+ 4.0%535256ZX Auto160.1%+ 0.0%574250.2%– 18.0%494657SWM150.1%newn/a280.0%new64 –58Fuso100.0%– 66.7%552100.1%– 18.9%565159DS70.0%– 77.4%562320.1%– 45.8%544860Iveco70.0%+ 0.0%541000.0%+ 203.0%585961Alfa Romeo60.0%– 40.0%59550.0%– 37.5%595562Maserati50.0%+ 25.0%58500.0%+ 16.3%605863Jaguar30.0%– 25.0%61380.0%– 2.6%625764Farizon20.0%new –80.0%new67 –65Bentley10.0%n/a–70.0%+ 40.0%6861 –Total Chinese7,09628.3%– 20.2%–74,01628.3%– 38.5%68– –Others40.0%– 50.0%–290.0%– 89.9%––
Chile October 2023 – models:
PosModelOct-23%/22Sep2023%/22PosFY221Toyota Hilux8263.3%+ 7.8%27,6442.9%+ 5.5%132Kia Soluto6252.5%+ 194.8%233,9751.5%+ 46.5%8193Great Wall Poer5412.2%+ 42.7%14,4131.7%– 14.1%584Suzuki Baleno5212.1%n/a83,7881.5%– 14.8%10125Chevrolet Groove5102.0%– 26.1%55,0241.9%+ 20.0%4106Maxus T604992.0%– 48.3%65,7142.2%– 42.3%327Suzuki Swift4651.9%+ 104.8%284,2231.6%+ 58.6%6208Mitsubishi L2004201.7%– 53.5%n/a6,8362.6%– 39.9%219Ford Ranger3851.5%– 12.9%43,6011.4%+ 23.9%122410Hyundai Grand i103331.3%+ 30.1%142,8641.1%+ 49.3%183811Toyota Yaris3231.3%– 6.6%183,2271.2%– 43.6%15912Hyundai Tucson3151.3%+ 15.8%132,8041.1%+ 2.0%192913Nissan Navara3101.2%– 3.4%34,0411.5%+ 15.6%71414MG ZS3051.2%– 6.2%73,8111.5%– 40.3%9415Mazda CX-52991.2%n/a123,5961.4%n/a13n/a16Haval Jolion2821.1%+ 70.9%92,7421.1%+ 32.1%213617Ford Territory2741.1%– 7.1%n/a2,6771.0%– 13.9%232718Kia Sonet2631.0%n/a212,2600.9%n/a28n/a19Peugeot 20082561.0%n/an/a1,9660.8%n/a39n/a20Ram 700 Pickup2551.0%– 36.7%202,2860.9%– 15.7%272821Chery Tiggo 2 Pro2521.0%+ 51.8%n/a2,2980.9%– 15.9%263022Peugeot Partner2491.0%+ 13.7%223,7851.4%– 3.9%111323Kia Morning2481.0%+ 39.3%n/a2,8791.1%– 42.0%171124Toyota Raize2481.0%– 3.5%193,3081.3%+ 33.5%142525Haval H62461.0%n/an/a2,0230.8%n/a36n/a26Ford F-1502401.0%n/a271,4810.6%n/an/an/a27Nissan Versa2320.9%– 28.4%102,7491.1%– 16.1%201728Toyota Corolla Cross2300.9%– 54.9%302,9611.1%+ 9.1%162329JMC Vigus2270.9%+ 21.4%n/a1,7130.7%– 32.5%413530Peugeot 2082240.9%– 8.6%n/a2,1860.8%+ 36.4%29n/an/aCitroen C32150.9%n/a151,6360.6%n/a42n/an/aToyota RAV42120.8%– 37.8%112,6921.0%– 52.3%227n/aPeugeot 30082020.8%– 19.2%241,9950.8%– 26.7%3732n/aChevrolet Tracker2010.8%– 48.6%251,9230.7%– 71.7%405n/aSuzuki S-Presso1930.8%+ 672.0%n/a2,1310.8%– 41.1%3116n/aCitroen Berlingo1840.7%+ 776.2%162,1690.8%+ 54.3%30n/an/aNissan Kicks1750.7%– 14.2%262,6431.0%– 32.5%2415n/aChevrolet Silverado1720.7%– 29.2%n/a1,9930.8%+ 109.8%38n/an/aSubaru Forester1710.7%n/an/a2,0430.8%n/a34n/an/aHyundai Creta1690.7%n/a172,3520.9%n/a25n/an/aHyundai Accent HCI1630.7%+ 14.8%292,1220.8%+ 15.5%32n/an/aMG31560.6%– 55.2%n/a2,1130.8%– 32.9%3322n/aChevrolet Montana1520.6%n/an/a9810.4%n/an/an/an/aKia Frontier1430.6%n/an/a5930.2%n/an/an/an/aChevrolet N400 Max1410.6%– 42.9%n/a1,5110.6%– 45.1%n/a31n/aSuzuki Celerio1370.5%n/an/a1,1110.4%n/an/an/an/aJAC JS21340.5%n/an/a2,0310.8%n/a3533n/aGreat Wall Wingle 71220.5%+ 1933.3%n/a1,4520.6%+ 56.3%n/an/an/aNissan X-Trail1210.5%n/an/a1,6050.6%n/a43n/an/aKia Rio1180.5%+ 136.0%n/a9280.4%– 58.1%n/a40n/aJAC T81160.5%– 48.0%n/a1,5860.6%– 47.7%4526n/aPeugeot 3081130.5%n/a n/a7900.3%n/an/an/an/aChangan Hunter1120.4%+ 9.8%n/a1,5160.6%– 23.4%n/an/an/aPeugeot Landtrek1080.4%– 63.5%n/a1,3750.5%– 24.4%n/a39n/aFoton G71060.4%n/an/a7260.3%n/an/an/an/aHyundai Porter1020.4%– 65.3%n/a1,3990.5%– 26.9%n/a37n/aMercedes Sprinter1020.4%+ 10.9%n/a7970.3%– 35.7%n/an/an/aMaxus C351000.4%+ 14.9%n/a6120.2%– 40.4%n/an/an/aMazda BT-50980.4%– 64.0%n/a1,3710.5%– 20.7%n/an/an/aPeugeot Boxer980.4%+ 104.2%n/a5980.2%– 15.3%n/an/an/aChevrolet Onix910.4%– 59.2%n/a1,2780.5%– 66.2%n/a18n/aSuzuki Dzire Sedan900.4%– 72.6%n/a1,0960.4%– 59.6%n/a34n/aMaxus G10880.4%+ 44.3%n/a7330.3%+ 20.2%n/an/an/aMaxus Deliver 9840.3%n/an/a4660.2%n/an/an/an/aSsangyong Grand Musso700.3%– 50.7%n/a1,2650.5%+ 12.9%n/an/an/aJAC Sunray700.3%n/an/a5180.2%n/an/a –n/aFoton TM3670.3%– 58.9%n/a1,0350.4%– 45.8%n/an/an/aFord Transit660.3%– 27.5%n/a6600.3%+ 0.5%n/an/an/aFoton Midi580.2%– 28.4%n/a7890.3%– 33.8%n/an/an/aChangan MD201580.2%+ 0.0%n/a6260.2%– 29.2%n/an/an/aJAC X200550.2%– 11.3%n/a5480.2%– 36.1%n/an/an/aRenault Kwid460.2%– 54.0%n/a1,1310.4%– 38.8%n/an/an/aHyundai HD 35350.1%– 35.2%n/a4810.2%– 40.2%n/an/an/aVW Amarok340.1%– 76.1%n/a1,0910.4%+ 14.5%n/an/an/aKarry Q22260.1%n/an/a4870.2%n/an/a –n/aChevrolet Colorado220.1%– 94.5%n/a1,5880.6%– 52.4%4421n/aOpel Combo L1170.1%– 57.5%n/a6800.3%– 12.9%n/an/a –Chevrolet Sail00.0%– 100.0%n/a9030.3%– 85.1%n/a6 –Ram Van 700 City00.0%– 100.0% –1,0040.4%– 43.4%n/an/a
Source: ANAC

