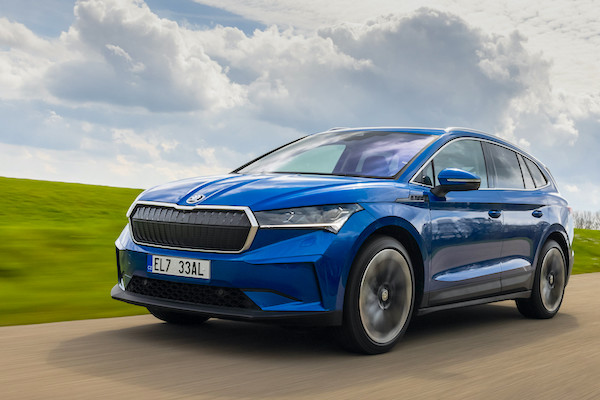
Austria October 2023: Skoda Enyaq celebrates first win, sales up 17.5%
The Skoda Enyaq is the best-selling vehicle in Austria in October.
18,867 new cars found a buyer in Austria in October, that’s a solid 17.5% year-on-year improvement. The year-to-date volume is now up 12.5% to 201,753. Volkswagen (-5.4%) underperforms again but comfortably remains in the brands pole position above Skoda (+17%) matching the market. BMW (+20.2%) and most strikingly Audi (+84.2%) post strong gains below unlike Mercedes (+6.3%). Dacia (+71.5%) is also in outstanding shape at #6 as is Cupra (+110.2%) at #10. Below, notice Tesla (+494.7%), Suzuki (+107.1%), MG (+64.7%), Opel (+62.2%) and Porsche (+55.3%).
Model-wise, the Skoda Enyaq (+91.1%) storms to its first ever win in Austria with 2.7% share, eclipsing its previous ranking record of #3 hit in September 2021. As a result it goes from #16 to #8 in the year-to-date order. The Dacia Sandero (+214.4%) is even more dynamic at #2, its best result since August 2022 when it finished #1. Leader year-to-date and last month, the Skoda Octavia (-3.3%) recedes to #3 for the month. It’s a great month for the BMW X1 (+129.1%) back up 9 spots on last month to #4 while the VW Golf (-1.1%) is down two ranks to #5. The VW ID.3 (+25%) shoots from outside the September Top 20 directly into 6th place, distancing the Toyota Yaris/Cross (-4.1%). The BMW i4 (+351.6%) scores its first Top 20 and Top 10 finish at #8.
Previous month: Austria September 2023: Audi up 78.6%, Tesla down -59.4%, market off -4.3%
One year ago: Austria October 2022: VW ID.4 teases Skoda Octavia for #1, market up 8.9%
Full October 2023 Top 46 All brands and Top 20 models below.
Austria October 2023 – brands:
PosBrandOct-23%/22Sep2023%/22PosFY221Volkswagen2,44413.0%– 5.4%128,56914.2%+ 9.1%112Skoda1,87810.0%+ 17.0%220,0169.9%+ 24.5%223BMW1,6428.7%+ 20.2%414,5177.2%+ 13.4%334Audi1,3987.4%+ 84.2%313,7926.8%+ 30.7%445Mercedes1,1246.0%+ 6.3%610,3895.1%+ 5.9%656Dacia9314.9%+ 71.5%87,9914.0%+ 22.9%9127Hyundai8784.7%– 4.0%58,1484.0%– 8.2%868Toyota8204.3%+ 25.0%118,4174.2%+ 15.9%799Kia8104.3%+ 22.9%77,7873.9%+ 5.3%101010Cupra6813.6%+ 110.2%96,5733.3%+ 39.7%141611Seat6603.5%– 24.2%1210,4605.2%+ 17.8%5812Renault6523.5%+ 5.0%107,3723.7%+ 16.2%121113Ford5843.1%– 34.1%137,4973.7%– 20.5%11714Mazda5653.0%+ 21.5%145,5982.8%+ 15.4%151415Opel4382.3%+ 62.2%164,7672.4%+ 4.4%161716Tesla3391.8%+ 494.7%157,0783.5%+ 66.3%131517Suzuki3231.7%+ 107.1%173,5241.7%+ 27.1%182018Peugeot3021.6%+ 1.3%184,2762.1%– 27.6%171319Volvo2941.6%– 0.7%192,6151.3%+ 12.9%212120Fiat2831.5%– 14.5%203,3741.7%– 14.8%191821MG1911.0%+ 64.7%242,1241.1%+ 173.0%222722Mini1901.0%+ 19.5%261,7660.9%– 5.4%252223Nissan1861.0%+ 24.0%251,9681.0%+ 25.0%232324Mitsubishi1851.0%+ 18.6%231,7920.9%+ 11.5%242425Citroen1831.0%– 6.6%213,1201.5%– 6.7%201926Porsche1600.8%+ 55.3%301,4160.7%+ 21.1%262527BYD1240.7%new287220.4%new31 –28Honda1170.6%+ 37.6%278000.4%– 17.7%302829Jeep1100.6%+ 26.4%221,0310.5%– 10.8%272630Land Rover730.4%+ 37.7%299820.5%+ 16.9%282931Alfa Romeo640.3%– 28.1%349370.5%+ 41.8%293032Polestar520.3%+ 8.3%336280.3%+ 30.3%323133Subaru470.2%+ 147.4%403010.1%+ 8.3%333334Fisker420.2%new321600.1%new37 –35DS210.1%+ 40.0%312570.1%+ 26.6%353436Lexus190.1%+ 46.2%352330.1%+ 18.9%363537Smart140.1%+ 100.0%38790.0%+ 23.4%393738Jaguar120.1%– 47.8%363000.1%– 5.7%343239Ineos80.0%new39340.0%new41 –40Ferrari70.0%+ 16.7%371050.1%+ 18.0%383641Maserati40.0%+ 100.0%45400.0%+ 42.9%403842Lamborghini30.0%+ 50.0%42240.0%– 17.2%453943Chevrolet30.0%n/a44220.0%+ 340.0%464744Chrysler 30.0%+ 50.0% –140.0%– 12.5%474345McLaren20.0%n/a –280.0%+ 833.3%435146KTM10.0%n/a –60.0%– 66.7%5142
Austria October 2023 – models:
PosModelOct-23%/22Sep2023%/22PosFY221Skoda Enyaq5162.7%+ 91.1%42,9981.5%+ 78.6%8202Dacia Sandero4812.5%+ 214.4%63,2511.6%– 9.4%653Skoda Octavia4332.3%– 3.3%15,9132.9%+ 48.3%114BMW X13621.9%+ 129.1%133,1581.6%+ 143.5%7n/a5VW Golf3601.9%– 1.1%34,3772.2%+ 33.2%346VW ID.33401.8%+ 25.0%n/a1,5420.8%+ 30.7%n/an/a7Toyota Yaris/Cross3261.7%– 4.1%73,6081.8%+ 8.3%428BMW i42801.5%+ 351.6%n/a1,3470.7%+ 217.7%n/an/a9Hyundai Tucson2661.4%+ 83.4%5n/an/an/an/an/a10VW Tiguan2651.4%– 37.4%163,2591.6%+ 8.9%5811Mercedes GLC2531.3%+ 78.2%n/an/an/an/an/a7912Hyundai Kona2511.3%+ 148.5%n/an/an/an/an/an/a13BMW X32481.3%+ 29.2%92,3141.1%+ 8.6%201314Kia Ceed2381.3%+ 72.5%17n/an/an/an/a5815Seat Ateca2371.3%+ 29.5%152,8921.4%+ 60.5%9n/a16Audi Q82341.2%+ 568.6%n/an/an/an/an/a13417Seat Ibiza2291.2%+ 11.2%n/a2,6631.3%+ 23.7%111518Skoda Karoq2221.2%+ 37.0%n/a2,6051.3%+ 89.5%121719VW Bus2191.2%+ 36.9%142,5141.2%– 25.0%14720VW ID.42191.2%– 51.0%n/a1,9481.0%+ 0.8%n/a10n/aTesla Model Y2061.1%+ 261.4%25,2752.6%+ 41.3%23n/aCupra Born2051.1%+ 83.0%82,4541.2%+ 17.4%1616n/aVW Polo1951.0%+ 33.6%n/a2,3911.2%– 25.0%189n/aSkoda Fabia1891.0%– 44.1%n/a2,4901.2%– 27.2%156n/aDacia Duster1720.9%– 35.8%192,3401.2%+ 11.7%1914n/aVW Caddy1560.8%– 5.5%n/a2,7531.4%+ 42.7%1018n/aTesla Model 31180.6%n/an/a1,4380.7%+ 175.5%n/an/an/aVW T-Roc920.5%– 30.3%n/a2,5421.3%+ 2.7%1311n/aSeat Arona830.4%– 41.1%n/a2,4191.2%+ 37.6%17n/a
Source: Statistik Austria

