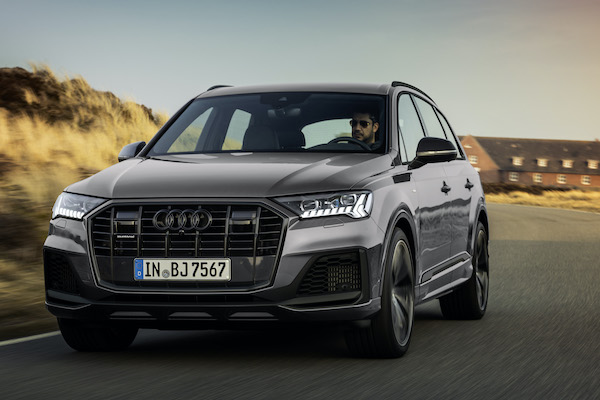
Belgium October 2023: Audi (+57.3%), Skoda (+49.6%), Volvo (+47.2%) impress in euphoric market
Audi manages the largest year-on-year gain in the Top 14 this month.
38,560 new cars hit Belgium roads in October, a splendid 26.6% year-on-year lift. Note October 2022 was already up 21.6% on the year prior. The year-to-date tally is now up 32.5% to 413,408. BMW (+25.7%) almost matches the market growth to easily grab the top spot of the brands charts, while Audi (+57.3%) manages the largest gain in the Top 14 and climbs two spots on last month to #2. Volkswagen (+16%) is weaker and loses the pole position it held last month to fall to #3. Mercedes (+31.3%) is solid at #4 whereas Peugeot (-13.7%) struggles at #5. Skoda (+49.6%), Volvo (+47.2%) and Renault (+41.5%) all post impressive scores below with Dacia (+23.3%) and Toyota (+4.5%) below the market growth rate in the remainder of the Top 10. Further down, Tesla (+541.9%), MG (+465%), Jeep (+401.7%) and Cupra (+291.2%) stand out, with the latter easily outselling its sister brand Seat.
Previous month: Belgium September 2023: Citroen, BMW shine, incl. exclusive YTD models data
One year ago: Belgium October 2022: Dacia, Volkswagen, Opel help lift market up 21.6%
Full October 2023 Top 60 All brands ranking below.
Belgium October 2023 – brands:
PosBrandOct-23%/22Sep2023%/22PosFY221BMW4,08010.6%+ 25.7%242,66110.3%+ 37.3%112Audi3,5879.3%+ 57.3%429,5737.2%+ 35.2%453Volkswagen3,2768.5%+ 16.0%139,1189.5%+ 40.7%224Mercedes3,0097.8%+ 31.3%330,5147.4%+ 22.3%335Peugeot2,1445.6%– 13.7%626,5506.4%+ 5.5%546Renault1,9995.2%+ 41.5%1022,0345.3%+ 33.9%677Skoda1,7554.6%+ 49.6%715,9673.9%+ 49.4%11148Toyota1,7214.5%+ 4.5%920,3164.9%+ 10.8%769Volvo1,6634.3%+ 47.2%1117,9844.4%+ 66.0%81210Dacia1,5514.0%+ 23.3%1617,8354.3%+ 35.6%9911Kia1,5454.0%+ 27.2%816,3864.0%+ 22.3%101012Citroen1,3223.4%– 1.6%514,5583.5%– 2.5%13813Ford 1,1803.1%+ 2.5%1214,9433.6%+ 28.4%121114Hyundai1,1613.0%+ 9.2%159,8262.4%+ 3.5%161515Tesla1,1042.9%+ 541.9%1413,1693.2%+ 307.3%152016Opel8652.2%– 31.5%1313,2993.2%+ 18.5%141317Nissan7511.9%+ 69.9%188,3712.0%+ 41.3%171718Mazda6701.7%+ 80.6%196,0311.5%+ 66.6%192119Cupra6691.7%+ 291.2%224,0331.0%+ 230.0%232820Mini5711.5%– 4.8%207,0681.7%+ 22.5%181621Fiat4851.3%– 29.2%175,4441.3%+ 11.6%211822Suzuki4331.1%+ 27.4%233,9921.0%+ 50.5%242423Seat4191.1%+ 30.9%215,7911.4%+ 18.0%201924Porsche4161.1%+ 122.5%273,4840.8%+ 20.5%262225Land Rover3390.9%+ 91.5%245,1181.2%+ 92.4%222326MG3390.9%+ 465.0%263,5830.9%+ 405.4%253327Jeep2910.8%+ 401.7%252,6370.6%+ 60.1%272628Polestar2200.6%+ 2.8%301,8500.4%+ 36.9%292729DS1680.4%– 21.1%282,3930.6%+ 2.4%282530Honda1560.4%+ 83.5%291,0370.3%– 22.3%333031Lexus1200.3%+ 122.2%329940.2%+ 59.8%343532Alfa Romeo1190.3%+ 25.3%311,5170.4%+ 122.8%303433SsangYong930.2%– 21.8%331,0410.3%+ 2.1%323134Lotus660.2%+ 2100.0%381430.0%+ 521.7%394935BYD640.2%+ 966.7%354630.1%+ 7616.7%364736Jaguar590.2%+ 9.3%348440.2%– 3.3%353237Subaru250.1%+ 19.0%373310.1%+ 56.9%373638Smart210.1%+ 425.0%39810.0%+ 9.5%444339Mitsubishi170.0%n/a50240.0%+ 300.0%515940Ferrari130.0%+ 116.7%451170.0%– 12.7%423841Alpine120.0%+ 300.0%401540.0%+ 51.0%384142Allied Vehicles90.0%+ 12.5%44640.0%– 50.0%454043Maserati70.0%– 56.3%411350.0%+ 26.2%404244Bentley70.0%– 41.7%43970.0%– 23.6%433945Lamborghini60.0%#DIV/0!51600.0%+ 15.4%464546Tripod60.0%+ 20.0%47560.0%+ 133.3%475047Dongfeng Sokon (DFSK)50.0%– 80.0%421240.0%– 24.8%413748Lynk & Co30.0%– 97.4%361,2960.3%+ 10.3%312949Aston Martin30.0%+ 50.0%48460.0%+ 4.5%494650FAW30.0%new –60.0%new65 –51Chery30.0%new6140.0%new66 –52BAIC20.0%– 83.3%46540.0%+ 5.9%484453Chevrolet20.0%+ 100.0% –130.0%– 27.8%545254Alpina10.0%– 50.0%52160.0%+ 166.7%535755Rolls-Royce10.0%– 50.0%54120.0%– 33.3%565156API10.0%– 50.0% –110.0%+ 57.1%575357SWM10.0%new49110.0%new586658Morgan10.0%+ 0.0%57100.0%+ 0.0%605559AMF10.0%n/a –60.0%+ 500.0%646760Aiways00.0%– 100.0%56340.0%– 5.6%5048
Source: FEBIAC


