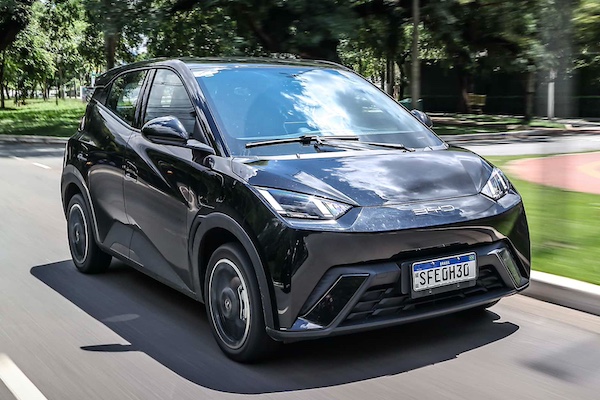
Uruguay June 2024: BYD smashes records
BYD holds 12% of the Uruguayan market in June.
The Uruguayan new car market edges up 1.1% year-on-year in June to 5,045 sales, meaning the H1 2024 volume is up 8.8% to 28,542. Chevrolet (-3.5%) holds onto the brands top spot with 18.1% share vs. 17.1% year-to-date. The performance of the month is without a doubt produced by BYD, up 879% year-on-year to #2 with a record 12% share, smashing its previous best of 5.7% hit last March. The Chinese brand now ranks #7 year-to-date with 5.5% share. Fiat (-8.4%) is relegated to 3rd place with 9.1% of the market. Citroen (+42.9%), Hyundai (+37.4%) and Nissan (+16.7%) beat the market in the remainder of the Top 10.
Previous month: Uruguay May 2024: Fiat, Hyundai, BYD impress in market edging up
One year ago: Uruguay June 2023: Chevrolet (+68.1%), Suzuki (+76%) top market up 21.1%
Full June 2024 Top 49 All brands ranking below.
Uruguay June 2024 – brands:
PosBrandJun-24%/23May2024%/23PosFY231Chevrolet91218.1%– 3.5%14,87617.1%+ 20.4%112BYD60712.0%+ 879.0%91,5815.5%+ 313.9%7113Fiat4609.1%– 8.4%23,68812.9%+ 41.2%224Hyundai4158.2%+ 37.4%42,2778.0%+ 49.5%365Volkswagen3567.1%– 6.3%52,0857.3%– 20.3%546Suzuki3436.8%– 52.4%111,8056.3%– 35.7%637Citroen2605.2%+ 42.9%71,5295.4%– 9.1%888Renault2535.0%– 21.9%32,1207.4%– 0.8%459Nissan2314.6%+ 16.7%81,3674.8%+ 12.0%10910Peugeot2194.3%– 38.1%61,4945.2%– 19.0%9711Toyota1653.3%– 31.0%101,1093.9%– 7.5%111012JAC811.6%+ 268.2%271860.7%+ 7.5%222313Jetour681.3%+ 21.4%143711.3%– 7.7%131314Volvo651.3%+ 333.3%40920.3%+ 2.2%282915Victory601.2%+ 15.4%163091.1%+ 28.8%161716Honda561.1%+ 107.4%133241.1%+ 103.8%142017BMW491.0%+ 19.5%192680.9%+ 16.0%171518Chery481.0%– 32.4%124601.6%+ 12.5%121219Ford420.8%– 46.8%202640.9%– 16.7%181420Jeep380.8%+ 26.7%152430.9%+ 35.8%192121DongFeng (incl. DFSK)350.7%– 34.0%183181.1%+ 43.9%151922Changan340.7%– 38.2%222240.8%– 17.0%201823Karry290.6%+ 480.0%231760.6%+ 74.3%242524GWM280.6%+ 12.0%261240.4%– 40.1%252225Mercedes260.5%– 39.5%211840.6%– 14.0%231626Ram260.5%+ 2500.0%30880.3%+ 1000.0%294627Kia210.4%+ 40.0%241040.4%+ 48.6%272828Geely200.4%– 35.5%172210.8%+ 44.4%212429Audi150.3%– 44.4%291150.4%– 8.7%262630Omoda130.3%new25420.1%new326231Mitsubishi130.3%– 79.0%35410.1%– 70.9%332732Mini90.2%+ 28.6%36350.1%– 5.4%363333Mazda70.1%– 68.2%31620.2%– 38.0%313034Seat70.1%+ 600.0%44290.1%+ 383.3%374735BAW60.1%new33150.1%new41 –36Bestune50.1%+ 66.7%47150.1%+ 7.1%424337Subaru30.1%– 70.0%28720.3%+ 22.0%303138Maxus30.1%– 78.6%34400.1%– 16.7%343239JMC30.1%+ 200.0%37220.1%+ 10.0%393740MG20.0%n/a41370.1%n/a35 –41Leapmotor20.0%n/a42180.1%+ 50.0%405242Foton20.0%+ 100.0%43140.0%+ 27.3%434143Land Rover20.0%+ 0.0%4890.0%– 47.1%464044Tesla10.0%new39230.1%new384245Today Sunshine10.0%n/a38120.0%n/a443946Maserati10.0%– 75.0% –40.0%– 50.0%505147Farizon10.0%new4630.0%new51 –48Jaecoo10.0%new –10.0%new55 –49Kaiyun10.0%n/a –10.0%n/a5845
Source: Autodata
