Ireland June 2024: Tesla up to 34.3% share, Model 3 and Y on top
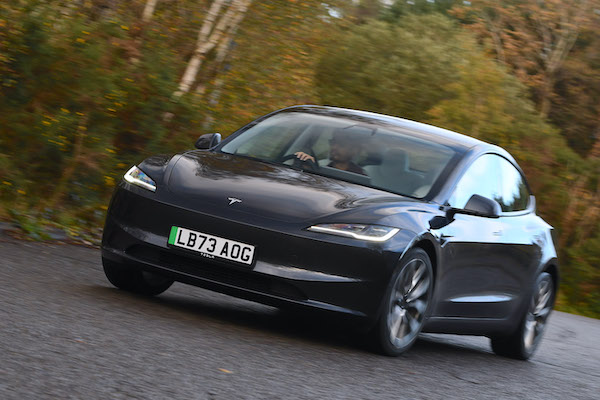
The Tesla Model 3 holds 19.4% of the Irish new car market in June.
Registrations thin out before the biannual licence plate change of July, and June Irish sales sink -50.2% year-on-year to just 1,490. The year-to-date tally remains in positive however at +1.7% to 78,932. As it was the case a year ago, Tesla (-50.6%) overwhelms the brands charts with a suffocating 34.3% share as it follows the market evolution. Toyota (-45.5%) is far below at 13.1% share in 2nd place, distancing Volkswagen (-62%) at 8.8%. Toyota (+6.4%) stays at #1 year-to-date while Tesla (-26.2%) can’t do better than #16. Kia (+37.2%) stands out with a stellar year-on-year lift but at 4% share it is well below its YTD level of 7.1%.
In the models charts, as expected the Tesla Model 3 (-25.1%) and Model Y (-65.8%) are ultra dominant at 19.4% and 14.9% share respectively. The Toyota Yaris Cross (-19.4%) advances two spots on last month to #3, ahead of the Skoda Octavia (-20%). The Toyota Corolla (+2.7%) and Kia Sportage (+117.6%) go against the negative market but remain at low volumes.
Previous month: Ireland May 2024: Dacia Sandero best-seller in declining market
One year ago: Ireland June 2023: Tesla holds 34.6% share
Full June 2024 Top 33 All brands and Top 158 All models below.
Ireland June 2024 – brands:
PosBrandJun-24%/23May2024%/23PosFY231Tesla51134.3%– 50.6%101,6012.0%– 26.2%16132Toyota19513.1%– 45.5%211,68214.8%+ 6.4%113Volkswagen1318.8%– 62.0%18,45910.7%– 1.4%224Skoda654.4%– 44.4%38,08310.2%+ 22.7%345Kia594.0%+ 37.2%65,6237.1%– 1.6%556Ford583.9%– 68.5%82,9253.7%– 29.9%967BMW553.7%– 11.3%73,0433.9%– 1.4%888Hyundai513.4%– 70.5%47,1389.0%+ 0.2%439Audi443.0%– 29.0%93,4964.4%+ 5.0%7710Dacia291.9%– 72.4%52,5933.3%– 25.5%11911Seat291.9%– 6.5%121,9692.5%+ 5.7%141612Opel261.7%– 29.7%131,7942.3%– 14.2%151513Citroen261.7%+ 0.0%237861.0%– 6.0%222114Mercedes251.7%– 59.0%142,0602.6%+ 1.5%131415Volvo201.3%– 23.1%161,1881.5%– 19.0%181716Peugeot191.3%– 52.5%152,9203.7%+ 1.6%101017Mini191.3%+ 5.6%272690.3%– 42.0%272418Suzuki171.1%– 64.6%181,4311.8%+ 10.1%171819Polestar161.1%+ 100.0%281220.2%– 41.3%292920Lexus140.9%+ 366.7%225970.8%+ 69.1%252521MG130.9%– 70.5%257300.9%+ 40.9%231922BYD120.8%– 33.3%249211.2%+ 715.0%202723Renault100.7%– 54.5%172,3062.9%+ 0.0%121224Cupra90.6%– 75.0%219301.2%+ 7.3%192025Land Rover90.6%+ 50.0%266630.8%+ 69.1%242326Porsche90.6%+ 28.6%292290.3%– 27.3%282827Nissan80.5%– 76.5%114,0085.1%+ 46.4%61128Mazda50.3%– 50.0%208931.1%+ 9.8%212229Jeep20.1%n/a36770.1%+ 54.0%323330Fiat10.1%– 93.8%193870.5%+ 36.3%262631Honda10.1%– 66.7%301080.1%– 32.5%303032SsangYong10.1%+ 0.0%31300.0%– 44.4%363533Smart10.1%n/a33200.0%n/a37 –
Ireland June 2024 – models:
PosModelJun-24%/23May2024%/23PosFY231Tesla Model 328919.4%– 25.1%1167801.0%+ 20.9%29322Tesla Model Y22214.9%– 65.8%28211.0%– 46.2%26113Toyota Yaris Cross583.9%– 19.4%52,1422.7%+ 0.4%544Skoda Octavia402.7%– 20.0%33,1424.0%+ 99.4%295Toyota Corolla382.6%+ 2.7%82,0302.6%– 14.5%636Kia Sportage372.5%+ 117.6%62,5633.2%+ 6.4%327Toyota RAV4291.9%– 9.4%112,3122.9%+ 61.3%4128Ford Puma271.8%– 44.9%221,0731.4%– 1.1%18189VW ID.4261.7%– 63.9%48661.1%– 57.4%24510VW Tiguan261.7%– 45.8%131,4961.9%+ 25.0%121411Hyundai Tucson241.6%– 77.4%163,4054.3%+ 5.5%1112VW Golf201.3%– 44.4%321,5101.9%+ 121.4%112113Toyota Yaris191.3%– 76.8%181,6662.1%– 13.1%7614Toyota Corolla Cross191.3%– 68.3%251,3411.7%+ 743.4%142615Toyota C-HR181.2%– 30.8%231,4321.8%– 26.5%13716Opel Astra181.2%+ 800.0%1042730.3%+ 21.3%8610417Ford Focus171.1%– 79.8%288541.1%– 24.0%251918Dacia Sandero171.1%+ 30.8%11,3041.7%– 3.0%151519VW Polo161.1%– 67.3%261,0481.3%+ 38.8%192520Citroen Berlingo161.1%+ 77.8%821460.2%+ 265.0%11613721Polestar 2161.1%+ 100.0%651220.2%– 41.3%12410822Audi Q5151.0%+ 400.0%642320.3%– 1.3%958923VW T-Roc140.9%– 75.9%121,1491.5%– 12.6%171324Hyundai Kona140.9%– 22.2%71,6482.1%+ 62.4%81025Ford Kuga120.8%– 62.5%108881.1%– 14.5%222026BMW IX1120.8%+ 300.0%562860.4%+ 472.0%8113927Seat Leon120.8%n/a1321220.2%+ 1255.6%12517828VW T-Cross110.7%– 21.4%295400.7%– 24.5%434129BMW X3110.7%n/a483030.4%+ 57.0%758730Toyota bZ4X100.7%– 78.3%792200.3%– 54.2%976231Dacia Duster90.6%– 50.0%319131.2%– 31.0%211732Mini Countryman90.6%+ 12.5%110620.1%– 46.6%15613333BMW 5-Series90.6%+ 28.6%356520.8%+ 9.2%365534Seat Arona80.5%+ 33.3%596420.8%– 12.1%373435Audi Q380.5%+ 60.0%387350.9%+ 51.5%315436Suzuki Vitara70.5%– 78.8%445440.7%+ 0.0%424537VW Arteon70.5%– 30.0%617000.9%+ 41.4%335338Audi Q470.5%– 12.5%673330.4%– 20.9%706539MG570.5%+ 0.0%101780.1%– 4.9%14612640Kia Niro70.5%+ 75.0%587380.9%– 18.9%302241Peugeot 300870.5%+ 133.3%377931.0%+ 8.8%283342BMW iX370.5%+ 600.0%114970.1%– 45.2%13610943Volvo XC9070.5%n/a743030.4%+ 1.3%768044Lexus LBX70.5%new921220.2%new123 –45Volvo XC6060.4%+ 50.0%194200.5%– 34.5%563846Hyundai i1060.4%+ 500.0%332810.4%– 20.6%836147BYD Seal60.4%new684660.6%new4824348Mini Coupe60.4%n/a21070.0%n/a228 –49BYD Atto 350.3%– 72.2%732740.3%+ 142.5%857550Peugeot 200850.3%– 58.3%577040.9%– 7.4%323051Seat Ateca50.3%– 58.3%243480.4%– 35.9%665152Skoda Kodiaq50.3%– 50.0%661,2741.6%+ 6.9%161653Opel Mokka50.3%– 44.4%895010.6%– 34.9%463754BMW 3-Series50.3%– 16.7%393940.5%+ 36.3%607955Skoda Fabia50.3%+ 25.0%275660.7%+ 61.3%416856Porsche Taycan50.3%+ 66.7%181610.1%– 49.2%15612857Kia Sorento50.3%+ 400.0%423640.5%+ 6.1%644358Renault Arkana50.3%n/a1698131.0%+ 10.5%272459Skoda Enyaq40.3%– 87.1%1114620.6%– 40.0%502760Mercedes CLA40.3%– 77.8%882470.3%– 15.1%887861Cupra Formentor40.3%– 76.5%754140.5%+ 7.3%575962Audi A440.3%– 75.0%515130.6%– 2.5%454663Suzuki SX4 S-Cross40.3%– 63.6%503860.5%+ 40.4%627764MG ZS40.3%– 60.0%1341350.2%+ 10.7%12211365Nissan Juke40.3%– 55.6%151,6402.1%+ 306.9%104866Hyundai Ioniq 540.3%– 55.6%783080.4%– 69.5%732867Kia Ceed40.3%– 50.0%836150.8%+ 15.0%384468Peugeot Rifter40.3%– 50.0%77890.1%+ 107.0%14315469VW Caddy40.3%– 33.3%103660.1%– 51.8%15213270Nissan Leaf40.3%– 20.0%1622370.3%– 35.1%928471Skoda Superb40.3%+ 0.0%856610.8%– 29.2%352372Suzuki Ignis40.3%+ 0.0%862340.3%+ 8.3%949273Toyota Aygo/X40.3%+ 300.0%703060.4%– 17.3%747474Volvo EX3040.3%new491890.2%new104 –75Range Rover Evoque40.3%n/a127560.1%– 32.5%15815076Dacia Jogger30.2%– 95.9%433760.5%– 53.6%633677Volvo XC4030.2%– 85.0%1601990.3%– 49.4%1037078BMW X530.2%– 75.0%343020.4%– 7.1%775779Cupra Leon30.2%– 75.0%1252410.3%+ 54.5%9010580Skoda Karoq30.2%– 57.1%549551.2%+ 20.7%202981Mercedes GLE30.2%– 50.0%1261610.2%+ 13.4%11212482Skoda Kamiq30.2%– 40.0%456780.9%+ 4.8%344283Mercedes GLC30.2%+ 0.0%802790.4%+ 22.4%849384Porsche Cayenne30.2%+ 0.0%971360.2%+ 6.3%12012985Seat Ibiza30.2%+ 200.0%364320.5%+ 69.4%559886Citroen C5 X30.2%+ 200.0%194490.1%– 9.3%16316487Mercedes E Class30.2%n/a303590.5%+ 95.1%6512088Lexus NX30.2%n/a602410.3%+ 54.5%9111989Audi A730.2%n/a201250.0%+ 127.3%18520490VW ID.320.1%– 93.1%984630.6%– 18.9%495091MG420.1%– 91.7%714770.6%+ 101.3%473192Hyundai i2020.1%– 90.9%628661.1%+ 15.3%233593Opel Corsa20.1%– 89.5%95850.7%+ 10.6%405894Renault Megane20.1%– 88.9%1331790.2%– 50.7%1076995Mini Hatch20.1%– 75.0%1121030.1%– 61.7%1348896Cupra Born20.1%– 71.4%412080.3%– 36.0%1006397Audi A320.1%– 60.0%635220.7%+ 17.3%445698BMW X120.1%– 60.0%873350.4%+ 41.9%699999Citroen C420.1%– 60.0%991730.2%+ 1.8%108118100Kia EV620.1%– 33.3%934110.5%– 31.3%5840101Citroen C5 Aircross20.1%– 33.3%1371830.2%– 32.2%10576102Land Rover Defender20.1%+ 0.0%1851030.1%+ 505.9%133149103Mini Clubman20.1%+ 0.0%171420.1%+ 68.0%166182104Range Rover 20.1%+ 100.0%118850.1%– 3.4%145142105Mercedes EQA20.1%+ 100.0% –500.1%– 9.1%162161106Renault Captur20.1%n/a844600.6%– 7.8%5247107Suzuki Swift20.1%n/a722460.3%+ 14.4%8997108Audi A520.1%n/a762040.3%+ 7.9%101103109Mazda CX-520.1%n/a1492020.3%+ 4.1%102100110Kia EV920.1%new1231730.2%new109229111VW ID.720.1%new461180.1%new126 –112Mercedes CLE Coupe20.1%new1071000.1%new135 –113Jeep Avenger20.1%new172450.1%new165225114Lexus UX20.1%n/a178390.0%+ 34.5%170171115BMW X220.1%n/a139320.0%+ 128.6%178223116BMW 2-Series10.1%– 93.8%1171530.2%– 49.0%11482117Seat Tarraco10.1%– 91.7%403970.5%+ 22.2%5973118VW Taigo10.1%– 91.7%532360.3%– 40.4%9367119Mercedes C Class10.1%– 91.7%153630.1%– 58.0%155125120Audi Q210.1%– 90.0%1131670.2%+ 11.3%110114121Hyundai Bayon10.1%– 85.7%1212870.4%– 7.1%8095122Audi A610.1%– 83.3%474610.6%+ 1.3%5160123Skoda Scala10.1%– 83.3%943450.4%+ 6.5%6781124Citroen C310.1%– 83.3%81900.1%– 50.3%140123125Mercedes GLB10.1%– 83.3%95900.1%– 44.1%141111126VW ID.510.1%– 83.3%119730.1%– 65.7%149107127Kia Picanto10.1%– 80.0%963000.4%+ 9.9%7872128Opel Crossland X10.1%– 75.0%1362120.3%– 29.8%9990129BMW 1-Series10.1%– 75.0%1521400.2%+ 40.0%117146130Mazda210.1%– 66.7%213120.4%+ 127.7%72117131Mazda CX-3010.1%– 66.7%1381400.2%– 36.7%118102132BMW i410.1%– 66.7%1471370.2%– 65.1%11971133Mercedes EQB10.1%– 66.7%176860.1%+ 11.7%144148134Kia Stonic10.1%– 50.0%524590.6%+ 22.1%5366135Mercedes EQE10.1%– 50.0%1281350.2%+ 10.7%121136136Mazda CX-6010.1%– 50.0% –1140.1%– 10.2%129122137Peugeot 30810.1%– 50.0%1051060.1%– 31.6%132121138Lexus ES10.1%– 50.0%148890.1%– 14.4%142135139Citroen C3 Aircross10.1%– 50.0%166600.1%– 17.8%157157140Mercedes S Class10.1%– 50.0%157390.0%+ 44.4%171185141Mercedes V Class10.1%– 50.0%141250.0%+ 212.5%187221142Renault Clio10.1%+ 0.0%144370.6%– 22.7%5439143Mercedes GLA10.1%+ 0.0%692940.4%– 21.4%7983144Lexus RX10.1%+ 0.0%1061060.1%+ 65.6%131143145Range Rover Velar10.1%+ 0.0%183220.0%– 59.3%191169146Ssangyong Korando10.1%+ 0.0%130210.0%– 59.6%193173147BYD Dolphin10.1%new1201810.2%new106198148Mercedes EQE SUV10.1%new205750.1%new147217149VW Touareg10.1%n/a129540.1%+ 285.7%160196150Peugeot 50810.1%n/a182510.1%+ 24.4%161172151Citroen E-C4 X10.1%new –390.0%new169210152Audi Q810.1%n/a –310.0%+ 0.0%179176153Ford Ecosport10.1%n/a174270.0%n/a181260154Honda Jazz10.1%n/a167270.0%– 57.8%182156155Porsche Panamera10.1%n/a –160.0%– 36.0%206180156BMW X410.1%n/a186130.0%– 23.5%211211156Smart #310.1%new14470.0%new229 –157Fiat 60010.1%new19130.0%new243 –158Peugeot Expert10.1%n/a –20.0%+ 0.0%257245
Source: SIMI

