
Czechia June 2024: Tesla up to #6, Skoda Kodiaq now #2 year-to-date
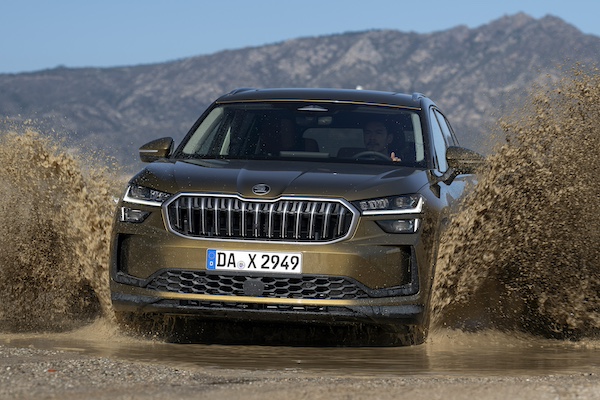
Skoda Kodiaq sales are up 76.6% year-on-year in June.
New car sales in Czechia are up a solid 9% year-on-year in June to 22,334 units, leading to a year-to-date volume up 3.2% to 119,221. Local behemoth Skoda (-5.1%) can’t take advantage of its home market’s growth and drops to 29.4% share vs. 33.5% so far this year. Hyundai (+20.6%) excels in 2nd place above Toyota (+9.3%) matching the market. Volkswagen (-21.9%) and Kia (-10.1%) struggle and round out the Top 5. Tesla shoots up 457.3% to #6 and 4.3% share and almost 1,000 sales, breaking into the Top 10 for the first time and literally smashing its previous records of #17 (November 2023), 1.3% share and 253 sales (last month). Peugeot (+59.9%), Renault (+43.7%) and Dacia (+27.6%) also impress in the remainder of the Top 10, with MG (+177.1%) and Citroen (+184.4%) shining below.
The Skoda Octavia (-33.4%) remains the most popular country at home but sees its share thaw to 6.8% vs. 9.8% over H1. The Skoda Kodiaq (+76.6%) is up to a record 2nd place, also reached last April. It is now also #2 year-to-date vs. #6 over the Full Year 2023. The Hyundai i30 (+33%) is the only non-Skoda in the Top 8 and sports an excellent result at #3, the same ranking as YTD. The Skoda Superb beats the market to advance to #5 while the Kamiq (+7.5%) and Karoq (+2.6%) are both relatively weak and the Scala (-19.9%) and Fabia (-12.3%) are in trouble. The Tesla Model 3 (+2000%) is up 73 spots on May to break into the Top 10 for the first time at #10. Notice also the MG ZS (+184.4%) up to a record #12 and the Dacia Duster (+114.5%) in outstanding shape.
Previous month: Czechia May 2024: Toyota up 40.9%, Hyundai i30 up to #2
One year ago: Czechia June 2023: Skoda Octavia and Scala top market up 9.3%
Full June 2024 Top 58 All brands and Top 301 All models below.
Czechia June 2024 – brands:
PosBrandJun-24%/23May2024%/23PosFY231Skoda6,56729.4%– 5.1%139,90233.5%– 2.9%112Hyundai2,40510.8%+ 20.6%211,5379.7%+ 9.9%223Toyota1,6147.2%+ 9.3%310,0338.4%+ 17.6%344Volkswagen1,4836.6%– 21.9%47,7346.5%– 20.0%435Kia9744.4%– 10.1%55,0434.2%– 14.3%556Tesla9534.3%+ 457.3%191,7131.4%+ 117.7%18227Dacia8844.0%+ 27.6%64,6793.9%+ 8.7%678Mercedes8183.7%+ 1.5%73,8973.3%– 16.1%769Renault6452.9%+ 43.7%112,6152.2%+ 16.9%121210Peugeot5552.5%+ 59.9%142,6822.2%+ 18.4%111011Ford5432.4%– 2.3%92,7562.3%– 13.0%10912Volvo5312.4%+ 80.6%82,7692.3%+ 94.6%91413MG4962.2%+ 177.1%132,0411.7%+ 98.7%141814BMW4211.9%– 27.2%102,9262.5%– 4.0%8815Citroen 4181.9%+ 184.4%171,7251.4%+ 55.8%172016Mazda3731.7%+ 65.0%211,1180.9%– 3.5%221917SsangYong3271.5%+ 12.0%122,1481.8%+ 29.3%131318Opel3231.4%– 2.1%181,7591.5%+ 10.1%161719Audi3021.4%– 18.6%161,6431.4%– 27.9%191120Suzuki2191.0%– 8.4%151,8371.5%+ 12.8%151521Lexus2050.9%+ 37.6%201,1951.0%+ 69.5%202322Cupra1850.8%+ 1.6%221,0780.9%+ 5.0%232123Nissan1450.6%+ 195.9%286340.5%+ 153.6%252624Honda1180.5%+ 122.6%236790.6%+ 99.7%242825Seat940.4%– 59.5%251,1431.0%– 28.8%211626Land Rover810.4%– 19.0%264280.4%– 7.4%282527Mitsubishi790.4%+ 102.6%274600.4%+ 162.9%273228Fiat720.3%– 10.0%313290.3%+ 14.6%292929Subaru700.3%– 2.8%244790.4%+ 21.9%262430Porsche500.2%– 25.4%293190.3%– 15.4%302731Jeep400.2%– 20.0%302300.2%+ 24.3%313032Mini340.2%+ 25.9%321950.2%– 15.2%323133DS300.1%+ 3.4%36980.1%– 26.9%353334Alfa Romeo280.1%+ 40.0%341220.1%+ 6.1%333435Dodge220.1%+ 175.0%331030.1%+ 94.3%343636Ferrari110.0%– 35.3%35620.1%– 20.5%363537Joyear100.0%new –210.0%new43 –38Jaguar80.0%+ 14.3%39590.0%+ 5.4%373739Forthing80.0%+ 700.0%37430.0%+ 437.5%384740Bentley60.0%+ 0.0%47260.0%+ 18.2%403941Lamborghini50.0%– 37.5%38420.0%+ 0.0%394042Chevrolet50.0%– 44.4%41260.0%+ 8.3%413843DFSK50.0%+ 25.0%44110.0%– 54.2%464244Maserati40.0%+ 0.0%43150.0%– 42.3%454145Smart40.0%n/a –50.0%+ 400.0%555846Dongfeng30.0%n/a –90.0%n/a48 –47Cadillac30.0%+ 50.0% –70.0%+ 16.7%515148Ineos20.0%– 50.0%48210.0%+ 250.0%424349Alpine20.0%– 71.4%40150.0%+ 25.0%445050Chrysler20.0%n/a –70.0%+ 75.0%525251Rolls Royce20.0%– 77.8%4560.0%– 75.0%544452Alpina10.0%– 50.0%4990.0%– 25.0%474553Nio10.0%new –90.0%new495754Aston Martin10.0%– 50.0%5070.0%– 41.7%504655SWM10.0%+ 0.0%4270.0%+ 600.0%536556Lotus10.0%+ 0.0% –40.0%– 76.5%564957KTM10.0%n/a –20.0%+ 100.0%595558FAW10.0%new –10.0%new63 – –Others1430.6%– 22.7% –4990.4%– 35.3% – –
Czechia June 2024 – models:
PosModelJun-24%/23May2024%/23PosFY231Skoda Octavia1,5286.8%– 33.4%111,6919.8%+ 0.2%112Skoda Kodiaq1,0724.8%+ 76.6%35,1694.3%+ 8.5%263Hyundai i309644.3%+ 33.0%25,0944.3%+ 28.3%374Skoda Kamiq8353.7%+ 7.5%74,8704.1%– 1.6%545Skoda Superb8243.7%+ 31.6%63,6433.1%– 2.1%896Skoda Karoq8023.6%+ 2.6%44,5563.8%– 5.4%657Skoda Scala7573.4%– 19.9%55,0114.2%+ 2.7%438Skoda Fabia6683.0%– 12.3%84,4823.8%– 20.4%729Hyundai Tucson5882.6%– 11.0%103,1592.6%– 7.0%9810Tesla Model 35882.6%+ 2000.0%838220.7%+ 1184.4%3011711Dacia Duster5192.3%+ 114.5%92,5302.1%+ 49.3%101312MG ZS4181.9%+ 184.4%131,5981.3%+ 103.0%142113Kia Ceed3971.8%– 24.5%142,0111.7%– 10.3%121114Hyundai i203921.8%+ 156.2%519610.8%+ 26.3%233715Toyota Corolla3651.6%+ 2.0%122,3512.0%+ 32.7%111216Tesla Model Y3571.6%+ 185.6%208610.7%+ 171.6%276017VW Golf3101.4%– 43.9%151,5841.3%– 27.0%151018Toyota RAV42951.3%+ 112.2%111,8891.6%+ 168.3%132319VW Tiguan2771.2%+ 64.9%171,3151.1%– 7.0%171520Kia Sportage2261.0%+ 3.7%191,1010.9%– 6.1%182021Mazda CX-52171.0%+ 164.6%814330.4%+ 27.0%577722Toyota Proace City2100.9%+ 32.9%181,0480.9%+ 54.1%213623Citroen C31910.9%+ 377.5%437220.6%+ 97.3%375424Dacia Jogger1880.8%– 14.9%241,0780.9%– 18.8%191925Peugeot 20081880.8%+ 108.9%349360.8%+ 59.2%243226Hyundai Bayon1830.8%+ 60.5%269110.8%+ 51.6%252927Toyota Yaris Cross1820.8%+ 0.0%221,3821.2%– 4.1%161428Volvo XC901700.8%+ 73.5%238580.7%+ 82.6%284929Opel Crossland X1680.8%+ 75.0%577290.6%+ 38.3%365630Dacia Sandero1670.7%– 20.1%281,0200.9%– 15.8%221731Toyota Yaris1640.7%– 11.4%258340.7%– 40.5%291632Ford Kuga1580.7%+ 102.6%367790.7%+ 11.8%323433VW Transporter1500.7%– 2.6%216830.6%+ 5.6%393934Cupra Formentor1470.7%+ 7.3%428670.7%+ 13.3%263135Renault Captur1440.6%+ 37.1%277940.7%+ 54.8%314436Kia Stonic1430.6%+ 169.8%335220.4%– 3.9%523837Renault Clio 1400.6%+ 8.5%376730.6%+ 4.8%414238Hyundai Kona1350.6%– 17.7%316770.6%– 13.4%403039Citroen Berlingo1340.6%+ 4366.7%492440.2%+ 360.4%9319840SsangYong Korando1260.6%– 50.2%161,0720.9%– 5.5%201841Toyota Proace1200.5%+ 33.3%327630.6%+ 8.5%342542Volvo EX301200.5%new502720.2%new82 –43VW Caddy1170.5%+ 5.4%357350.6%– 9.6%352444BMW X51130.5%– 21.5%465780.5%+ 14.0%444345Toyota Aygo X1130.5%+ 18.9%874690.4%– 9.6%545046Mercedes GLC1120.5%+ 166.7%385440.5%+ 35.3%486247Nissan Qashqai1110.5%+ 236.4%753560.3%+ 176.0%699448VW Passat1060.5%+ 16.5%445450.5%– 8.1%474549Mercedes V Class1050.5%– 33.5%594070.3%– 34.8%604150Peugeot 2081050.5%+ 29.6%735610.5%+ 35.2%465751Ford Focus1050.5%+ 36.4%414620.4%+ 5.0%555952Volvo XC601030.5%+ 47.1%297040.6%+ 76.4%385353SsangYong Tivoli1030.5%+ 5050.0%485410.5%+ 246.8%4912754Ford Transit/Tourneo Custom1000.4%+ 22.0%722570.2%– 49.1%884855Toyota C-HR970.4%– 44.6%396410.5%– 6.4%432756VW Polo970.4%+ 36.6%673990.3%+ 24.7%616857Peugeot 308950.4%+ 3.3%685260.4%+ 32.2%515858Mercedes GLE890.4%– 26.4%404330.4%– 40.1%583359Renault Trafic840.4%+ 189.7%971910.2%+ 114.6%11016360Peugeot Rifter820.4%+ 4000.0%661650.1%– 4.6%11714861VW Multivan800.4%+ 9.6%544790.4%+ 44.3%536762Renault Kangoo800.4%+ 247.8%921960.2%+ 145.0%10816863Hyundai i10790.4%+ 58.0%454600.4%+ 38.6%566664Renault Arkana780.3%+ 44.4%1291900.2%– 34.5%1117865Ford Puma740.3%– 35.7%476470.5%+ 8.4%423566Mercedes E Class720.3%+ 414.3%633180.3%+ 241.9%7814267Skoda Enyaq710.3%– 36.0%714330.4%– 17.4%592668Audi Q8640.3%– 11.1%1232520.2%– 44.7%905269BMW X1640.3%– 1.5%553450.3%+ 0.3%717070Opel Astra 610.3%+ 8.9%533400.3%+ 48.5%7210071Lexus NX610.3%+ 29.8%583970.3%+ 73.4%629572Lexus RX590.3%+ 78.8%653890.3%+ 63.4%648173Suzuki S-Cross580.3%– 47.3%307630.6%– 0.8%332874Suzuki Vitara580.3%– 18.3%565780.5%+ 4.5%454675Mercedes Vito570.3%– 13.6%1052050.2%– 34.5%1048676Mercedes GLS570.3%+ 11.8%742700.2%– 20.1%837677Mercedes GLB570.3%+ 103.6%782950.2%+ 69.5%8110178SsangYong Torres570.3%new793400.3%new7315479VW T-Cross560.3%+ 9.8%773040.3%– 35.0%806580Honda CR-V530.2%+ 71.0%643650.3%+ 93.1%6610281Kia Proceed520.2%+ 48.6%525320.4%+ 57.9%507382Mazda CX-60520.2%+ 79.3%1301570.1%– 14.7%12110383VW Touran490.2%– 69.4%853520.3%– 58.4%702284Kia Xceed490.2%+ 4.3%843570.3%– 28.0%685585Suzuki Swift490.2%+ 58.1%1112050.2%+ 50.7%10512086Suzuki Ignis490.2%+ 113.0%892560.2%+ 120.7%8912987VW Touareg480.2%– 51.5%1202610.2%– 1.5%878788VW T-Roc480.2%– 43.5%603260.3%– 5.8%767289Volvo XC40480.2%– 42.2%863360.3%+ 2.4%746490BMW X7460.2%– 11.5%693320.3%+ 47.6%759091Renault Austral460.2%+ 21.1%992390.2%+ 71.9%9511192MG HS460.2%+ 84.0%613060.3%+ 45.7%799693Audi Q3430.2%+ 2.4%1042180.2%– 37.2%1007494Audi A6430.2%+ 22.9%762330.2%– 2.1%968395Peugeot 3008420.2%+ 147.1%1411630.1%– 40.1%1189996Seat Arona400.2%– 42.9%1322630.2%– 58.2%864797Renault Megane400.2%– 41.2%902210.2%– 47.0%997998SsangYong Rexton400.2%+ 14.3%911800.2%– 14.7%11410899Audi A4390.2%+ 129.4%822270.2%+ 114.2%97147100Volvo V90370.2%+ 131.3%1012410.2%+ 205.1%94131101Mitsubishi ASX360.2%+ 100.0%942070.2%+ 696.2%102185102VW Taigo350.2%– 53.9%882470.2%– 51.5%9161103Mercedes CLA350.2%– 25.5%962060.2%– 22.8%10385104Subaru Outback350.2%+ 45.8%802460.2%+ 83.6%92107105Lexus LBX350.2%new136670.1%new179 –106Opel Mokka340.2%– 68.8%1383220.3%– 7.7%7784107Audi Q5340.2%– 22.7%1691320.1%– 36.2%136110108Fiat 500340.2%– 5.6%1611470.1%+ 22.5%125141109Opel Combo340.2%+ 466.7%701530.1%+ 15.0%124167110BMW 5 Series330.1%– 43.1%1072220.2%– 26.0%9889111Hyundai Staria330.1%– 32.7%1451210.1%– 21.4%142115112Mercedes GLA330.1%+ 10.0%1082020.2%+ 18.1%107109113Kia Sorento330.1%+ 37.5%1131190.1%– 9.8%144121114Mazda6330.1%+ 50.0%1541120.1%+ 3.7%149149115Citroen C4320.1%– 8.6%1123840.3%+ 43.3%6597116Honda HR-V320.1%+ 220.0%1251360.1%+ 288.6%131183117Cupra Leon310.1%– 18.4%1171920.2%– 5.0%109114118Seat Leon310.1%– 11.4%1283960.3%+ 182.9%6375119Volvo V60310.1%+ 244.4%931700.1%+ 183.3%115189120Audi Q7300.1%– 60.0%1261190.1%– 70.9%14371121Mazda CX-30300.1%– 36.2%1101670.1%– 25.1%11698122Ford Transit270.1%– 32.5%951370.1%– 13.8%130123123Kia Picanto270.1%+ 17.4%1491400.1%+ 44.3%128145124Toyota Camry270.1%+ 22.7%622660.2%+ 55.6%84105125Hyundai Ioniq 5270.1%+ 125.0%175850.1%+ 21.4%162181126Mercedes G Class260.1%+ 0.0%1561150.1%– 28.1%146119127VW Arteon250.1%– 70.6%1402100.2%– 51.7%10169128Mercedes C Class250.1%– 24.2%1391410.1%– 51.9%12793129Mitsubishi Space Star250.1%+ 31.6%1031610.1%+ 22.9%119140130MG 4250.1%+ 2400.0%116920.1%+ 2966.7%155227131Land Rover Defender240.1%– 17.2%143910.1%– 32.6%156122132Citroen C3 Aircross240.1%– 4.0%1551230.1%– 16.9%141136133Peugeot 408230.1%+ 130.0%1331320.1%+ 38.9%137126134Ford Mustang Mach-E230.1%+ 130.0%159650.1%+ 116.7%181210135BMW 3 Series220.1%– 46.3%1062630.2%– 13.5%8580136Kia Rio210.1%– 82.1%207780.1%– 87.0%17040137VW California210.1%+ 90.9%188460.0%+ 35.3%196233138Porsche Cayenne210.1%+ 425.0%1511010.1%+ 24.7%152139139Lexus ES200.1%– 31.0%1531580.1%+ 105.2%120158140Mercedes A Class200.1%– 16.7%1191390.1%– 28.4%129113141Mazda3200.1%– 16.7%1481330.1%– 15.8%135124142Mini Countryman200.1%+ 66.7%1311000.1%+ 9.9%153169143Nissan X-Trail200.1%+ 1900.0%1351340.1%+ 605.3%134162144Ford Tourneo Courier200.1%new1221120.1%new148354145BMW X6190.1%+ 5.6%1341350.1%– 4.9%132125146Citroen C4 X190.1%+ 5.6%210900.1%+ 30.4%157179147Toyota Highlander190.1%+ 35.7%1271560.1%+ 151.6%123177148Fiat Panda190.1%+ 171.4%162780.1%+ 129.4%169207149Peugeot 5008180.1%– 60.0%1441820.2%– 38.1%11391150Mercedes Sprinter180.1%+ 12.5%160680.1%– 6.8%178170151Range Rover 180.1%+ 20.0%152810.1%+ 17.4%166164152Renault Espace180.1%new166800.1%new167246153Opel Corsa170.1%– 62.2%1141570.1%– 28.0%12282154Citroen C5 Aircross170.1%+ 466.7%1001340.1%+ 88.7%133166155Mercedes CLE170.1%new102860.1%new161333156Seat Ateca160.1%– 83.7%1373630.3%– 33.8%6751157BMW X3160.1%– 67.3%1681440.1%– 45.5%12688158Mercedes S Class160.1%– 61.9%182780.1%– 61.0%171106159Ford Tourneo Connect160.1%– 51.5%981890.2%+ 43.2%112118160BMW 7 Series160.1%– 11.1%1641070.1%+ 12.6%150159161Subaru Forester160.1%– 5.9%142830.1%+ 27.7%164182162DS 4160.1%+ 14.3%276410.0%– 30.5%202197163Honda Civic160.1%+ 220.0%183760.1%+ 1.3%172160164Volvo S60160.1%+ 300.0%1211280.1%+ 509.5%140172165Jeep Avenger160.1%+ 700.0%147630.1%#DIV/0!182218166Porsche 911140.1%– 48.1%157870.1%– 13.9%159153167Lexus LC140.1%+ 250.0%181410.0%+ 41.4%203222168Honda ZR-V140.1%+ 600.0%173750.1%+ 3650.0%173215169Alfa Romeo Stelvio140.1%+ 600.0%236540.0%+ 31.7%187213170Range Rover Sport130.1%– 53.6%1241130.1%+ 2.7%147144171BMW 4 Series130.1%– 18.8%1181290.1%– 17.3%139116172Ford Mustang130.1%+ 0.0%211250.0%– 54.5%235211173Audi A5130.1%+ 116.7%1151160.1%+ 100.0%145188174Mitsubishi Colt130.1%new202670.1%new180353175Audi A3120.1%– 64.7%1092030.2%– 14.0%106104176Kia EV6120.1%– 40.0%209500.0%– 36.7%190176177Jeep Compass120.1%– 20.0%150790.1%+ 51.9%168165178Mazda2110.0%– 21.4%170730.1%– 31.8%175156179BMW ix1110.0%+ 175.0%171600.1%+ 66.7%183195180BMW X2110.0%+ 450.0%184520.0%+ 188.9%188257181VW ID.3100.0%– 79.6%194420.0%– 64.7%201132182Dacia Spring100.0%– 50.0%222460.0%– 31.3%195192183Mercedes Citan100.0%– 44.4%198850.1%– 49.7%163133184Mini 100.0%– 28.6%191550.0%– 40.2%186161185Audi A7100.0%– 9.1%213430.0%– 12.2%197191186DS 7 Crossback100.0%+ 0.0%190490.0%+ 2.1%191203187Nissan Juke100.0%+ 25.0%247970.1%+ 273.1%154230188Subaru Crosstrek100.0%new204310.0%new221341189Mercedes EQT100.0%new252160.0%new254334190Lexus UX90.0%– 74.3%2161070.1%– 14.4%151135191Fiat Tipo90.0%– 74.3%254390.0%– 61.0%204134192VW ID. Buzz90.0%+ 50.0%179330.0%– 45.0%219194193Mercedes EQA90.0%+ 80.0%189360.0%– 2.7%210208194Alfa Romeo Giulia90.0%+ 800.0%203380.0%+ 375.0%205259195VW ID.790.0%new172740.1%new174372196BMW 2 Series80.0%– 69.2%1651290.1%+ 30.3%138150197VW ID.480.0%– 66.7%227220.0%– 80.0%240157198Kia Niro80.0%– 42.9%163810.1%– 50.0%165130199BMW X480.0%– 42.9%192690.1%– 10.4%176175200Mercedes EQB80.0%+ 0.0%220350.0%+ 29.6%212221201Porsche Panamera80.0%+ 33.3%233180.0%– 33.3%245228202Mazda MX-580.0%+ 60.0%178280.0%+ 55.6%229254203BMW i470.0%– 12.5%177560.0%+ 14.3%185178204BMW IX70.0%+ 0.0%200330.0%– 15.4%216201205Toyota bZ4X70.0%+ 75.0%146510.0%+ 104.0%189209206Range Rover Evoque70.0%+ 133.3%195330.0%+ 3.1%217225207Toyota GT86/GR8670.0%n/a221480.0%+ 500.0%192155208Renault Scenic70.0%new206180.0%new246 –209Seat Tarraco60.0%– 72.7%158890.1%– 3.3%158143210Opel GrandLand X60.0%– 64.7%186470.0%– 58.8%193146211Mercedes EQS60.0%– 53.8%244170.0%– 63.0%250180212Mercedes AMG GT60.0%– 45.5%230300.0%– 9.1%222220213VW ID.560.0%– 33.3%255120.0%– 77.4%274205214Range Rover Velar60.0%– 25.0%229330.0%+ 10.0%218212215Jaguar F-Pace60.0%+ 50.0%225290.0%+ 16.0%226223216Land Rover Discovery Sport60.0%+ 100.0%248340.0%+ 0.0%215224217BMW Z460.0%+ 200.0%197270.0%+ 17.4%231250218BMW i560.0%new174340.0%new214279219Renault Rafale60.0%new30170.0%new287 –220Alfa Romeo Tonale50.0%– 68.8%245290.0%– 54.7%224190221Subaru BRZ50.0%– 58.3%180690.1%+ 4.5%177151222Land Rover Discovery50.0%– 44.4%185350.0%+ 12.9%211226223Mercedes EQE50.0%– 44.4%228320.0%– 13.5%220187224Mercedes B Class50.0%– 37.5%212370.0%– 24.5%208196225Jeep Wrangler50.0%– 16.7%167420.0%+ 223.1%200270226VW Crafter50.0%– 16.7% –100.0%– 50.0%279255227Mitsubishi Eclipse Cross50.0%+ 150.0%223230.0%+ 53.3%238244228Kia EV950.0%new215380.0%new206241229Fiat 60050.0%new237290.0%new225 –230Toyota Land Cruiser40.0%– 91.3% –870.1%– 72.0%16092231Mercedes SL40.0%– 69.2% –80.0%– 84.9%284193232BMW 1 Series40.0%– 42.9%193370.0%– 36.2%207204233Audi Q440.0%– 33.3% –140.0%– 57.6%260219234Audi A840.0%– 33.3%258120.0%– 52.0%270236235Cupra Ateca40.0%+ 0.0%279110.0%– 52.2%276256236Ford Explorer40.0%+ 33.3%246180.0%– 52.6%244231237Mini Cabrio40.0%+ 300.0%243260.0%+ 13.0%232251238Suzuki Swace40.0%+ 300.0%232190.0%+ 111.1%243290239Ferrari 29640.0%+ 300.0%266140.0%+ 75.0%262278240MG 540.0%new205210.0%new242335241Smart Fortwo40.0%n/a –50.0%n/a299362242Subaru XV30.0%– 82.4%241350.0%– 66.0%213128243BMW 2 Series Active Tourer30.0%– 72.7%253580.0%– 45.3%184152244MG EHS30.0%– 50.0%231230.0%– 8.0%237240245Honda Jazz30.0%– 40.0%257250.0%– 34.2%236216246Porsche Cayman30.0%– 25.0%262220.0%+ 4.8%239234247Lamborghini Urus30.0%– 25.0%251170.0%+ 54.5%249283248Bentley Continental30.0%+ 50.0%287150.0%+ 150.0%257261249Lexus RZ30.0%+ 200.0%238160.0%+ 1500.0%253319250Mercedes T Class30.0%+ 200.0%265160.0%+ 1500.0%255280251DFSK Fengon 530.0%+ 200.0% –40.0%– 50.0%301293252Ferrari Purosangue30.0%new239140.0%new263351253Lexus LS30.0%n/a27250.0%+ 400.0%294303254Volvo S9020.0%– 84.6%261300.0%+ 15.4%223247255Audi Q220.0%– 77.8%176460.0%+ 24.3%194232256Porsche Taycan20.0%– 71.4%219170.0%– 41.4%251238257Alpine A110 20.0%– 71.4%224150.0%+ 25.0%256276258Nissan Townstar20.0%– 60.0%242370.0%– 38.3%209199259DS 320.0%– 60.0% –40.0%– 73.3%302273260Mercedes EQV20.0%– 50.0%264150.0%+ 36.4%258269261Rolls Royce Cullinan20.0%– 50.0% –20.0%– 83.3%326282262Ineos Grenadier20.0%– 33.3%294210.0%#DIV/0!241242263Mazda MX-3020.0%+ 100.0%281140.0%+ 75.0%265284264Maserati Grecale20.0%+ 100.0%27870.0%– 53.3%286252265Toyota Prius20.0%n/a293290.0%n/a228286266Nissan Leaf20.0%n/a27050.0%+ 400.0%297309267DS 920.0%n/a –40.0%+ 300.0%303336268Volvo EC4020.0%new –20.0%new327 –269Citroen C5 X10.0%– 93.3%274130.0%– 84.5%266174270Porsche Macan10.0%– 92.3%187430.0%– 36.8%198173271BMW XM10.0%– 92.3%199270.0%– 15.6%230184272BMW 8 Series10.0%– 83.3%259140.0%– 39.1%261237273Audi A110.0%– 83.3%235100.0%– 61.5%277239274Kia Stinger10.0%– 83.3% –30.0%– 85.7%310262275Peugeot 50810.0%– 80.0%29690.0%– 35.7%281245276Hyundai Ioniq 610.0%– 75.0%234170.0%– 39.3%247206277Lamborghini Huracan10.0%– 66.7%249170.0%+ 13.3%248264278Audi R810.0%– 66.7%28270.0%+ 0.0%285295279Bentley Bentayga10.0%– 66.7% –60.0%+ 50.0%289296280Ferrari SF90 Stradale10.0%– 66.7% –50.0%– 64.3%293277281Suzuki Across10.0%– 50.0%226130.0%+ 116.7%269275282Peugeot Traveller10.0%– 50.0%28850.0%– 37.5%298265283Cupra Born10.0%– 50.0% –10.0%– 96.3%344202284Volvo C4010.0%+ 0.0%218260.0%– 25.7%233214285Fiat 500X10.0%+ 0.0%263250.0%+ 108.3%234253286Jaguar F-Type10.0%+ 0.0%286140.0%+ 75.0%264288287Ferrari 812 Superfast10.0%+ 0.0% –60.0%– 40.0%290268288Subaru Impreza10.0%+ 0.0%29760.0%+ 500.0%291321289Toyota Supra10.0%+ 0.0%28360.0%– 40.0%292260290Jaguar XF10.0%+ 0.0% –40.0%– 50.0%304305291Opel Zafira Life10.0%+ 0.0% –20.0%– 60.0%325314292Lexus RC10.0%n/a29850.0%n/a295328293Opel Vivaro10.0%n/a25040.0%+ 0.0%305324294Alpina 310.0%n/a29930.0%+ 50.0%308338295BMW iX310.0%n/a28530.0%– 72.7%309291296Bentley Flying Spur10.0%n/a –20.0%+ 100.0%315301297DFSK Fengon 50010.0%new –20.0%new316 –298Ferrari Daytona10.0%n/a –20.0%n/a318352299Forthing T510.0%new –20.0%new320342300Maserati Quatttroporte10.0%n/a –10.0%n/a346 –301Volvo EX4010.0%new –10.0%new347 –
Source: SDA CIA

More Stories
Polestar Exits the U.S. Market as Connected Car Rules Reshape the EV Landscape
Polestar’s run in the United States is coming to an unexpected and rather abrupt halt. The Swedish EV brand, spun...
2026 Chevrolet Silverado 2500HD Invoice Pricing: Why This Truck Negotiates Differently Than a 1500
Heavy-duty trucks play by different rules than half-ton pickups, and the 2026 Silverado 2500HD makes that clear before you even...
What Happens to Your Safety Features When a Windshield Is Replaced
Image Source Windshield replacement has become a different kind of repair. The glass still blocks wind, rain, and debris, but...
Why Choosing Expert Windshield Replacement Matters – Advice from Super Auto Glass
Quick Answer A compromised windshield weakens your vehicle’s frame and disrupts critical safety systems. Expert technicians ensure correct adhesive application,...
Why Car Events Need Better Small Merch Ideas
Car shows, club meets, rally gatherings, and weekend displays all have one thing in common: people want to take a...
2027 GMC Sierra 1500 Brings Bigger Screens, New V8 Power, and a Bolder Denali Attitude
The GMC Sierra 1500 has always walked that fine line between work-ready pickup and premium everyday truck, and for 2027,...