Luxembourg June 2024: BMW overtakes Volkswagen in market off -9.3%
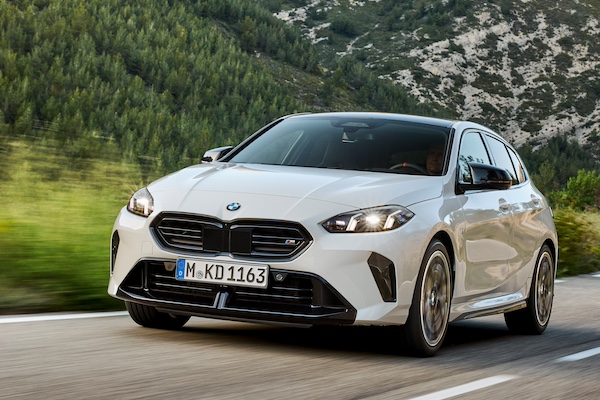
BMW is the most popular carmaker in Luxembourg in June.
New car sales in Luxembourg falter -9.3% year-on-year in June to 4,324 units, bringing the year-to-date tally off -5.3% to 25,085. BMW (+4.8%) takes the lead of the brands charts for the 4th time in the past 12 months, dislodging a freefalling Volkswagen (-26.3%) for just 12 sales. Audi (-27.3%) and Mercedes (-25.9%) follow but struggle while Tesla (+72.1%) is in stellar shape and rises 10 spots on May to #5 with 5.9% share. Volvo (+79.4%) and Hyundai (+60.7%) are equally impressive in the remainder of the Top 10. Further down, Citroen (+158.7%), Ford (+31.7%) and Seat (+23.6%) stand out.
Previous month: Luxembourg May 2024: Sales back in negative (-12.6%), BMW catches up on Volkswagen
One year ago: Luxembourg June 2023: Dacia, Kia shine, sales up 32.8%
Full June 2024 Top 50 All brands ranking below.
Luxembourg June 2024 – brands:
PosBrandJun-24%/23May2024%/23PosFY231BMW 52112.0%+ 4.8%22,92711.7%+ 13.1%222Volkswagen50911.8%– 26.3%13,25313.0%+ 1.8%113Audi 3067.1%– 27.3%41,7176.8%– 19.3%444Mercedes2816.5%– 25.9%31,8797.5%– 18.6%335Tesla2535.9%+ 72.1%159964.0%+ 28.7%786Skoda2265.2%– 21.8%51,5796.3%+ 6.0%557Hyundai1964.5%+ 60.7%108873.5%+ 33.8%8128Volvo1924.4%+ 79.4%98813.5%+ 34.9%9119Renault1593.7%+ 0.0%61,1804.7%– 9.2%6710Kia1563.6%+ 6.1%78083.2%+ 1.5%10911Peugeot 1423.3%– 46.6%137012.8%– 55.6%12612Citroen1192.8%+ 158.7%214261.7%– 31.4%181913Fiat1142.6%– 10.2%86502.6%– 25.9%131314Ford 1082.5%+ 31.7%146372.5%+ 10.0%141815Opel1082.5%– 32.5%183991.6%– 62.4%201016Porsche1052.4%– 28.6%117563.0%+ 9.9%111417Toyota1002.3%– 16.7%176232.5%+ 22.2%151718Seat681.6%+ 23.6%164651.9%+ 16.3%172219Cupra631.5%– 23.2%203751.5%– 23.2%222020Dacia551.3%– 69.1%125992.4%– 0.7%161621Land Rover511.2%– 42.7%193801.5%– 7.3%212322DS501.2%+ 100.0%301330.5%– 22.7%282723Mini491.1%– 44.9%253421.4%– 33.3%231524Suzuki491.1%+ 104.2%272280.9%+ 54.1%262825Mazda421.0%+ 35.5%232831.1%+ 36.1%242626MG400.9%+ 48.1%314231.7%+ 222.9%192427Nissan340.8%– 30.6%242811.1%– 43.3%252128Alfa Romeo340.8%+ 70.0%261370.5%+ 35.6%272929BYD280.6%+ 1300.0%281280.5%+ 4166.7%295330Smart270.6%+ 1250.0%34880.4%+ 51.7%343531Polestar200.5%+ 0.0%291160.5%+ 31.8%313032Jeep160.4%– 5.9%221040.4%– 28.8%322533Honda150.3%+ 87.5%321220.5%+ 48.8%303234Jaguar110.3%– 68.6%33900.4%– 28.6%333135Subaru110.3%+ 37.5%36750.3%– 1.3%353436Lexus90.2%– 55.0%35700.3%– 9.1%363337Lamborghini90.2%– 18.2%38350.1%– 27.1%383638Alpine80.2%+ 300.0%37280.1%+ 86.7%404339Aston Martin70.2%+ 133.3%41230.1%+ 9.5%414240Bentley60.1%+ 200.0%42190.1%– 17.4%434541Chevrolet40.1%– 33.3% –50.0%– 85.7%493942Ferrari30.1%– 81.3%39470.2%+ 6.8%373743Maserati20.0%– 33.3%44290.1%– 21.6%393844DFSK20.0%– 33.3%40200.1%+ 0.0%424045Ford (USA)20.0%– 75.0%48100.0%– 50.0%454446Cadillac10.0%+ 0.0%4690.0%– 25.0%464647Alpina10.0%+ 0.0%4960.0%– 40.0%485048Rolls-Royce10.0%+ 0.0% –30.0%+ 200.0%535649SWM10.0%– 50.0% –30.0%– 57.1%544950Tripod10.0%n/a –10.0%n/a60 – –Others90.2%n/a –690.3%n/a – –
Source: Statistiques Luxembourg

