Italy June 2024: Market up 15%, Dacia and Tesla at all-time highs
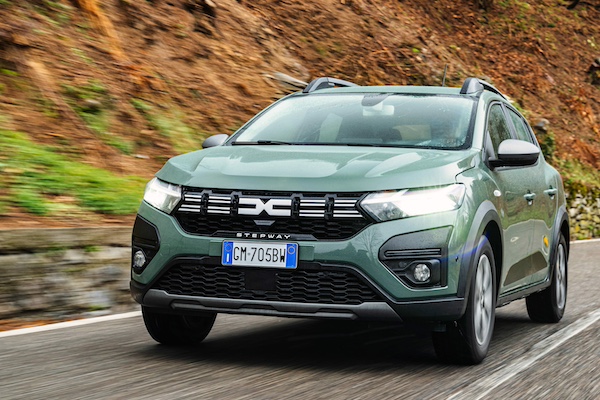
The Dacia Sandero ranks #2 in Italy in May.
It’s a great month for new car sales in Italy, up 15% year-on-year to 160,046 units. The year-to-date tally is now up 5.3% or 45,000 units to 886,386. The event of the month is the record share of BEVs at 8.3% of the market vs. 4.4% a year ago thanks to incentives finally available. However these incentives were spent in just 9 hours so many potential buyers didn’t benefit from them. Without further incentives, new orders are currently at a standstill. BEVs are up 118% this month to 13,415. Petrol sales are up 6.7% to 42,779 and 26.5% share vs. 28.4% in June 2023, diesel is don -20.4% to 20,741 and 12.8% share vs. 18.5%, LPG soars 37.1% to 16,325 and 10.1% share vs. 8.4%, HEVs are up 27.2% to 62,476 and 38.7% share vs. 34.8% including 17.991 full hybrids (+30.5%) and 44,485 mild hybrids (+26%). PHEV (-25.9%) disappoints at 5,607 and 3.5% share vs. 5.4%. Despite this, rechargeable cars gain 38.7% to 19,022 and a record 11.8% share vs. 9.8% in June 2023.
Encouragingly, private sales surge 25.7% to 96,038 and 59.5% share vs. 54.2% a year ago. Self registrations soar 88.2% year-on-year to 21,885 and 13.6% share vs. 8.2%. In contrast long term leases drop -15.4% to 30,415 and 18.8% share vs. 25.5% in June 2023 and short term rentals sink -45.9% to 4,773 units and 3% share vs. 6.3%. Company sales edge up 1.7% to 8,309 and 5.1% share vs. 5.8%. Year-to-date, private sales are up 7.9% to 492,970 and 55% vs. 53.6% over H1 2023, self registrations are up 34.6% to 99,968 and 11.1% share vs. 8.7%, long term leases drop 15.6% to 186,044 and 20.7% share vs. 25.9%, short term rentals gain 31.1% to 69,259 and 7.7% share vs. 6.2% and company sales are up 1.5% to 48,830 and 5.4% share vs. 5.6%.
In the brands ranking, Fiat (+30%) finally posts a relatively solid month at 10.6% share, keeping in mind June 2023 marked its lowest ever market share at the time at 9.4%. Dacia (+50.6%) skyrockets 11 spots on May to #2 overall with 11,750 sales 7.3% share. This is obviously the manufacturer’s best ranking and share in Italy, also reached last January, and an all time high monthly volume record, eclipsing the 10,319 also hit last January. Toyota (+44.1%) is also in outstanding shape at #3 and cements its 2nd place year-to-date. Volkswagen (-3%) can’t capitalise on the market growth and falls two spots on May to #4. Citroen (+85.4%) and Renault (+42.7%) also shine in the remainder of the Top 10 whereas Peugeot (-8.9%) struggles. Tesla (+185.2%) is up 17 ranks on last month to #12 with 4,993 sales and 3.1% share, smashing its previous bests of #18, 2,129 sales and 2.7% reached last August.
Over in the models lane, the Top 5 vastly outpace the market with at least double-digit gains. The Fiat Panda (+54.9%) breathes again at #1 with 6.6% share, albeit lower than the 7.2% it commands year-to-date. The Dacia Sandero (+68.1%) returns to the 2nd place it holds year-to-date, displacing the Citroen C3 (+101.7%) with its outgoing generation still in runout mode. The Renault Clio (+204%) stuns at #4 while the Fiat 500 (+90.1%) is back up 18 spots on May to #5 vs. #15 year-to-date. The Lancia Ypsilon (-4.5%) is down to #6 as the new generation prepares itself for its long awaited launch, distant the Jeep Avenger (+80.5%). The Tesla Model 3 (+225%) breaks into the Italian Top 10 for the first time at #10.
Previous month: Italy May 2024: Negative market, Fiat hit lowest ever share, Citroen C3 up to #2
One year ago: Italy June 2023: Fiat at lowest ever share again, MG ZS cracks Top 10
Full June 2024 Top 50 All brands and Top 50 models below.
Italy June 2024 – brands:
PosBrandJun-24%/23May2024%/23PosFY231Fiat16,91810.6%+ 30.0%195,60210.8%+ 2.0%112Dacia11,7507.3%+ 50.6%1352,0385.9%+ 11.5%443Toyota11,2907.1%+ 44.1%366,4077.5%+ 26.9%234Volkswagen11,0766.9%– 3.0%265,4607.4%– 4.1%325Renault10,6996.7%+ 42.7%446,9875.3%+ 13.0%566Citroen7,6894.8%+ 85.4%1039,1804.4%+ 41.3%7117Peugeot6,9064.3%– 8.9%743,7874.9%– 9.1%678Audi6,8134.3%+ 4.3%538,5564.3%+ 5.9%1099Jeep6,4514.0%+ 3.9%638,8914.4%– 2.7%8810BMW6,0363.8%+ 14.8%837,4364.2%+ 22.3%111011Ford5,6233.5%– 25.0%938,6334.4%– 17.8%9512Tesla4,9933.1%+ 185.2%2910,1311.1%+ 18.9%232613Hyundai4,8703.0%+ 3.1%1127,6753.1%+ 9.1%121314Mercedes4,8553.0%+ 17.6%1226,3663.0%+ 1.9%131215Kia4,8163.0%+ 18.0%1425,3612.9%+ 0.5%151416Opel4,1812.6%+ 4.8%1525,6272.9%– 3.7%141617Lancia4,1492.6%– 4.5%1624,6912.8%+ 3.5%161518Nissan4,0112.5%+ 33.4%1922,5042.5%+ 26.2%171719MG3,9852.5%+ 18.2%1721,2612.4%+ 49.5%182020Suzuki3,6012.2%+ 15.1%2020,4492.3%+ 12.7%191821Skoda3,2952.1%+ 6.1%1819,4422.2%+ 11.4%201922Volvo1,8421.2%+ 1.3%2310,7071.2%+ 12.7%222523Cupra1,6711.0%+ 2.3%249,4161.1%+ 17.6%242424DR Motor1,4520.9%– 11.6%229,3451.1%– 32.4%252225Alfa Romeo1,3580.8%– 55.0%2112,1781.4%– 16.7%212126Mazda1,3030.8%+ 12.4%267,6560.9%– 5.7%272727Mini1,0050.6%– 39.0%277,0470.8%– 32.5%282328Seat9980.6%– 21.7%257,7240.9%+ 11.7%262829Land Rover9860.6%– 12.6%285,5820.6%+ 11.6%292930Lexus8100.5%+ 105.1%352,8720.3%+ 46.8%343631Honda8030.5%+ 68.7%334,1000.5%+ 43.7%313332Smart7060.4%+ 93.4%362,1650.2%– 12.3%363433EVO6890.4%– 15.1%323,2650.4%+ 14.6%323134Porsche5870.4%+ 19.6%314,7450.5%+ 23.3%303035DS4250.3%– 37.7%343,1670.4%– 27.9%333236Maserati2130.1%– 55.2%371,4440.2%– 35.0%373537Mitsubishi1830.1%+ 128.8%302,3200.3%+ 215.2%354038BYD1380.1%new454050.0%new44n/a39Subaru1350.1%– 53.1%387780.1%– 46.9%383840EMC950.1%+ 23.4%416530.1%+ 69.2%40n/a41Jaguar790.0%– 69.0%426310.1%– 33.9%413942Lamborghini590.0%+ 43.9%442830.0%+ 20.9%464443Ferrari580.0%+ 7.4%434080.0%+ 3.8%434344Sportequipe550.0%+ 71.9%476970.1%+ 720.0%39n/a45Lotus380.0%+ 245.5%461910.0%+ 193.8%474646Polestar330.0%– 73.4%481030.0%– 81.6%494147Lynk & Co310.0%– 90.4%405310.1%– 82.2%423748SsangYong270.0%+ 58.8%393390.0%+ 118.7%454549Mahindra150.0%– 88.9%491410.0%– 70.7%484250Aston Martin110.0%+ 37.5%50550.0%+ 7.8%5047 –Others2340.1%+ 160.0% –9540.1%+ 140.9% – –
Italy June 2024 – models:
PosModelJun-24%/23May2024%/23PosFY231Fiat Panda10,6106.6%+ 54.9%164,0507.2%+ 26.4%112Dacia Sandero7,6504.8%+ 68.1%833,8173.8%+ 29.4%223Citroen C34,6762.9%+ 101.7%226,3403.0%+ 86.9%384Renault Clio4,4532.8%+ 204.0%718,7782.1%+ 56.7%7135Fiat 5004,2542.7%+ 90.1%2314,6961.7%– 25.9%1556Lancia Ypsilon4,1492.6%– 4.5%324,6882.8%+ 3.5%437Jeep Avenger3,9232.5%+ 80.5%420,8632.4%+ 175.2%5188Renault Captur3,5462.2%+ 25.6%1116,8721.9%+ 2.2%1079Toyota Yaris Cross3,3222.1%+ 13.2%519,5302.2%– 1.0%6410Tesla Model 33,2822.1%+ 225.0%n/a5,3440.6%+ 10.6%48n/a11Nissan Qashqai2,8121.8%+ 39.3%2012,8701.5%+ 25.3%192112Toyota Yaris2,8111.8%+ 29.5%1017,5582.0%+ 30.4%81613VW T-Roc2,7551.7%– 2.9%617,0221.9%– 4.3%9614Dacia Duster2,7301.7%+ 6.2%3214,7371.7%– 11.0%141015MG ZS2,6551.7%+ 11.5%915,6421.8%+ 99.4%122216Opel Corsa2,6111.6%+ 55.6%1213,2551.5%– 3.1%171717Toyota Aygo X2,4491.5%+ 117.9%1812,0171.4%+ 98.0%213018Peugeot 20082,2991.4%+ 1.5%2213,8491.6%+ 17.3%161519VW T-Cross2,1971.4%+ 36.7%1413,0031.5%+ 13.7%182020VW Tiguan2,1561.3%+ 47.4%218,7701.0%– 11.0%272821Audi Q32,0701.3%+ 41.9%139,8831.1%+ 13.1%243122Peugeot 2082,0471.3%+ 3.5%1616,3371.8%+ 38.6%111423Kia Sportage2,0411.3%+ 6.2%1512,2571.4%+ 20.9%202324Ford Puma1,8351.1%– 42.5%1715,3401.7%– 5.8%13925BMW X11,8071.1%+ 26.5%259,9411.1%+ 47.9%233226Tesla Model Y1,6991.1%+ 154.7%n/a4,6590.5%– 3.6%n/an/a27Hyundai i101,6581.0%+ 20.7%198,6711.0%+ 20.8%283328Peugeot 30081,5811.0%– 23.5%286,9450.8%– 53.7%372429Kia Picanto1,4830.9%+ 64.6%345,9970.7%– 2.2%433930Citroen C3 Aircross1,4690.9%+ 67.3%377,9500.9%+ 3.5%323531Jeep Renegade1,4200.9%– 38.3%319,6911.1%– 50.9%251132Toyota C-HR1,3900.9%+ 194.5%268,0060.9%+ 45.3%31n/a33Suzuki Ignis1,3030.8%+ 27.1%495,9410.7%+ 13.3%454334Renault Twingo1,2680.8%+ 59.7%n/a4,0480.5%+ 47.0%n/an/a35VW Polo1,2140.8%– 37.3%298,1600.9%– 12.3%302636Citroen C4 1,2010.8%+ 269.5%n/a2,6090.3%+ 17.5%n/an/a37Hyundai Tucson1,1960.7%– 7.9%416,1090.7%– 27.9%413438Cupra Formentor1,1920.7%– 10.2%425,9340.7%– 9.1%463639Jeep Compass1,1860.7%– 37.1%248,9421.0%– 34.8%261940Ford Kuga1,1490.7%– 21.5%307,7310.9%– 26.0%332741Mercedes GLA1,0520.7%+ 78.3%367,0250.8%+ 28.1%353742Skoda Kamiq1,0200.6%n/an/a4,9930.6%n/a50n/a43Suzuki Swift9880.6%#DIV/0!n/an/an/an/an/an/a44Fiat Tipo9740.6%– 18.9%n/an/an/an/an/a4445Audi A39610.6%– 23.2%447,0910.8%+ 22.6%344146Alfa Romeo Tonale9260.6%– 59.6%278,6451.0%– 18.7%292547Audi A19190.6%+ 22.0%40n/an/an/an/a4748VW Golf9170.6%– 26.3%436,3200.7%– 7.7%394549Hyundai i209150.6%– 1.8%466,0920.7%n/a42n/a50Volvo XC408960.6%– 12.2%47n/an/an/an/an/an/aSkoda Fabia8690.5%n/a395,0290.6%n/a49n/an/aSuzuki Vitara8360.5%n/an/a5,9670.7%n/a4450n/aFord Focus8020.5%– 37.2%356,8110.8%– 31.5%3829n/aVW Taigo7490.5%– 23.0%n/a6,1560.7%+ 4.4%4049n/aNissan Juke7460.5%– 18.3%456,9700.8%n/a3640n/aFiat 500X5240.3%– 81.2%3310,6881.2%– 36.0%2212n/aOpel Mokka5180.3%– 45.4%n/a5,5020.6%– 18.1%4742
Source: UNRAE

