
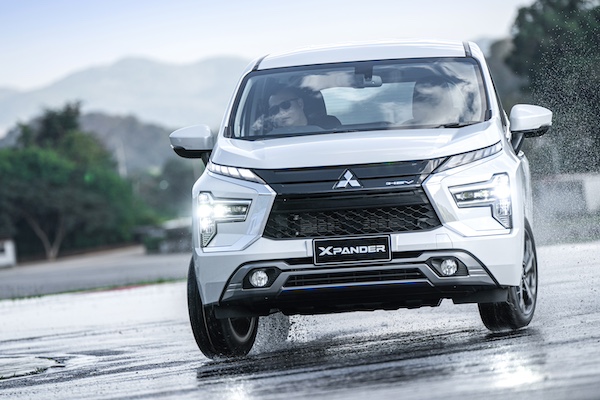
Vietnam May 2024: Mitsubishi Xpander now #1 YTD in recovering market
The Mitsubishi Xpander is now the favourite of Vietnamese consumers YTD.
Based on data by local association VAMA, new vehicle sales in Vietnam rally back up 24.4% year-on-year in May to 25,794. Keep in mind May 2023 was down -52.7% on the year prior. This way, the year-to-date tally is now off -4.6% to 108,309. Adding Hyundai sales that are reported separately from VAMA, these figures climb to 30,708 for the month (+26.4%) and 127,643 YTD (+0.5%). Note local carmaker Vinfast has stopped reporting monthly sales data.
In the brands ranking, Toyota (+43.4%) and Hyundai (+37.5%) both vastly outrun the market to 17.4% and 16% share respectively vs 13.4% and 15.1% so far the year. Thaco-Kia (+0.2%) is stat at #3. Hyundai retains the YTD lead. Ford (+40%) and Mitsubishi (+74.8%) also shine whereas Honda (-32.9%) and Mazda (-0.9%) underperform.
As for models, the Mitsubishi Xpander lodges a 4th monthly win this year, this time by a large margin of one percentage point of share above the Ford Ranger (+58.5%). As a result the Xpander topples the Ranger to secure the YTD pole position. The Toyota Corolla Cross (-1.8%) shoots back up 60 spots on April to #3 but loses ground year-on-ear. The Hyundai Accent is up one rank on last month to #4 while the new Toyota Yaris Cross is down one to #5.
Previous month: Vietnam April 2024: Mitsubishi Xpander #1 for just one sale, Toyota Yaris Cross and Innova Cross up
One year ago: Vietnam May 2023: Vinfast VF 8 most popular in devastated market (-48.8%)
Full May 2024 Top 15 All brands and Top 70 All models below.
Note: Brands data include medium and heavy commercial vehicles, models data doesn’t. Some brands such as BMW, Lexus, Mini and Peugeot don’t share models detail.
Vietnam May 2024 – brands:
PosBrandMay-24%/23Apr2024%/23PosFY231Toyota5,35617.4%+ 43.4%117,16013.4%– 20.4%322Hyundai4,91416.0%+ 37.5%219,33415.1%– 15.6%113Thaco-Kia4,02413.1%+ 0.2%317,91314.0%– 14.4%234Ford3,27010.6%+ 40.0%414,14411.1%– 1.1%445Mitsubishi3,15110.3%+ 74.8%511,7099.2%+ 10.6%566Mazda2,2907.5%– 0.9%610,1177.9%– 10.8%657Honda1,1793.8%– 32.9%79,1007.1%+ 12.8%778Isuzu8122.6%+ 4.1%93,3082.6%+ 1.4%9109Suzuki7532.5%– 57.4%85,9494.7%– 11.4%8910Hyundai Trucks2360.8%+ 103.4%108430.7%+ 96.0%111511Peugeot2340.8%+ 37.6%111,0660.8%+ 1.8%101112BMW+Mini1510.5%+ 15.3%126600.5%– 11.3%131313Hino1480.5%+ 14.7%137500.6%– 17.6%121214Lexus1400.5%– 16.7%145500.4%– 14.7%141415Samco250.1%+ 19.0%151620.1%+ 100.0%1516
Vietnam May 2024 – models:
PosModelMay-24%/23Apr2024%/23PosFY231Mitsubishi Xpander1,7665.8%+ 50.8%16,5375.1%– 2.4%112Ford Ranger1,4774.8%+ 58.5%26,3014.9%+ 4.8%243Toyota Corolla Cross9963.2%– 1.8%631,3671.1%– 76.2%2984Hyundai Accent9243.0%+ 0.4%54,0203.1%– 32.0%325Toyota Yaris Cross9022.9%new42,9392.3%new8346Mazda CX-58922.9%– 2.1%84,0113.1%– 4.0%437Ford Everest8112.6%+ 27.7%93,6122.8%– 7.3%598Mitsubishi Xforce8022.6%new62,9422.3%new7 –9Toyota Vios7662.5%+ 30.7%33,4462.7%– 0.9%6510Toyota Veloz6042.0%+ 2.4%142,0971.6%– 42.4%141211Ford Territory5401.8%+ 29.8%192,2011.7%– 22.8%111312Mazda25091.7%+ 31.9%202,0111.6%+ 11.2%182513Hyundai Santa Fe4961.6%+ 77.8%121,5461.2%– 22.4%241614Kia Seltos4811.6%+ 6.9%182,0201.6%– 19.2%171115Toyota Innova Cross4611.5%new71,5351.2%new266116Hyundai Stargazer4441.4%+ 62.6% –5740.4%– 66.8%482717Kia Carnival4421.4%+ 7.8%172,0261.6%– 1.5%152118Toyota Raize4331.4%– 1.8%261,5641.2%– 40.5%232419Hyundai Tucson4301.4%+ 157.5%161,5301.2%+ 32.2%271820Hyundai Creta4221.4%– 15.3%152,1281.7%– 43.7%13721Ford Transit4131.3%+ 25.5%131,9511.5%+ 39.6%192622Kia Sonet3661.2%– 57.7%112,8182.2%– 18.9%10623Hyundai Grand i103191.0%– 21.6%341,8891.5%– 40.0%201424Honda CR-V3171.0%– 2.8%102,0231.6%+ 35.3%161925Kia K33151.0%+ 57.5%291,1380.9%– 12.1%333326Suzuki Carry Pro3081.0%new271,2151.0%new316727Toyota Hilux3081.0%+ 1239.1% –3080.2%+ 450.0%547128Mazda33051.0%– 24.7%241,6241.3%– 19.4%221529Honda City3031.0%– 70.7%212,8732.3%– 37.9%91030Hyundai Venue2951.0%new281,1730.9%new326931Kia Carens2931.0%+ 42.9%231,4791.2%+ 24.8%283032Suzuki Ertiga2870.9%+ 537.8%381,1220.9%+ 429.2%345433Honda BR-V2560.8%new251,3041.0%new303534Toyota Fortuner2460.8%– 14.3%318730.7%– 43.6%373135Hyundai Custin2310.8%new351,0980.9%new354636Mazda CX-32150.7%+ 83.8%418130.6%+ 11.5%414837Mitsubishi Attrage2130.7%– 33.2%378140.6%– 59.1%402238Hyundai Elantra2130.7%+ 43.9%467090.6%– 30.8%453739Toyota Wigo2000.7%n/a309870.8%n/a364540Kia Sportage1950.6%+ 21.9%367450.6%– 35.9%434241Honda Civic1920.6%+ 113.3%406630.5%+ 13.7%465342Mazda CX-81750.6%– 19.0%398590.7%– 15.0%383643Toyota Avanza1670.5%– 17.7%437500.6%– 37.3%422944Mitsubishi Triton1630.5%+ 14.8%447420.6%– 10.0%443845Hyundai Palisade1530.5%new474910.4%new506346Mitsubishi Outlander1390.5%– 7.3%523920.3%– 47.7%514047Mazda CX-301160.4%+ 13.7%425780.5%– 15.4%474748Suzuki Carry1150.4%– 58.8%331,5381.2%– 13.4%253249Honda HR-V1070.3%– 64.1%322,1971.7%+ 63.7%122850Toyota Camry1070.3%– 46.0%455550.4%– 54.0%494151Kia Sorento940.3%– 8.7%493250.3%– 54.3%525052Mazda6780.3%– 24.3%562160.2%– 57.8%585553Kia Morning740.2%– 38.3%503200.3%– 55.7%534954Toyota Land Cruiser710.2%+ 163.0%482200.2%+ 34.1%576055Mitsubishi Pajero Sport680.2%+ 223.8%582820.2%– 12.4%555856Toyota Innova410.1%– 80.0%518300.7%– 13.1%394457Toyota Corolla350.1%– 71.8%551930.2%– 74.0%605258Isuzu D-Max330.1%+ 32.0%571390.1%– 50.2%626259Ford Explorer290.1%+ 20.8%532790.2%+ 100.7%566560Kia Soluto250.1%– 72.2%591410.1%– 69.1%615661Suzuki Swift210.1%– 56.3%602080.2%+ 21.6%596462Kia K5200.1%– 78.0%621110.1%– 71.2%635763Toyota Alphard190.1%+ 171.4%64480.0%– 2.0%667064Suzuki XL7150.0%– 93.0%221,7521.4%+ 41.4%213965Isuzu MU-X120.0%– 36.8%61670.1%– 4.3%656666Honda Accord40.0%– 50.0%65400.0%+ 53.8%677367Suzuki Jimny30.0%new54880.1%new64 –68Suzuki Ciaz30.0%+ 0.0%6680.0%– 42.9%697469Suzuki Super Carry Pro10.0%– 99.9% –180.0%– 99.5%6820
Source: VAMA
More Stories
RV Pricing Data Sources Beyond a Book Value: What Dealers Actually Use in 2026
Most RV dealers start pricing with a book value, and for good reason. It gives you a defensible baseline. But...
Don’t Let a Crash Ruin Your Build: Essential Documentation Tips for Las Vegas Drivers
It took you years to assemble your project car. One distracted driver on I-15 or near the Strip, a single...
OEM Truck Suspension Was Designed for Everyone. That Is Why It Works for No One.
Every major truck manufacturer faces the same engineering constraint when designing a stock suspension system. The vehicle must appeal to...
2026 Chevrolet Colorado Invoice Pricing: Why Every Trim Has the Same Engine and Different Personality
The Colorado simplifies one part of midsize truck shopping that trips people up on almost every other pickup in this...
Lamborghini Teases a Wilder Urus That Could Take the Super SUV Fight to Another Level
Lamborghini looks ready to turn up the heat on the Urus once again, and the teaser image alone is enough...
10 Reliable Used Sedans Under $15,000 in 2026
Finding a dependable used sedan for under $15,000 is still very possible in 2026, even with the average used vehicle...