
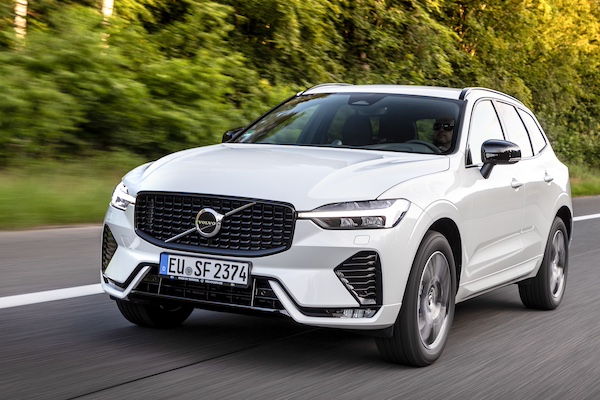
Sweden May 2024: Tesla (-56.2%) implodes, Volvo XC60 distant leader
Volvo XC60 sales are up 49.6% in May.
New car sales in Sweden drop a harsh -11.9% year-on-year in May to 25,094 units, leading to a year-to-date tally down -4.9% to 106,893. The main event this month is the freefall of BEV sales at -34.7% year-on-year to just 7,614 units and 30.3% share vs. 40.9% a year ago. This is to be attributed to a poor result from Tesla as we’ll see below. In contrast petrol sales are up 7.4% to 6,258 and 24.9% share vs. 20.5%. PHEVs skid -2.5% to 5,824 and 23.2% share vs. 21% and HEVs soar 41.5% to 2,878 and 11.5% share vs. 7.1% in May 2023. Year-to-date, BEVs are off -20.8% to 32,880 and 30.8% share vs. 36.9% over the same period last year, petrol is up 5.2% to 25,848 and 24.2% share vs. 21.9%, PHEVs gain 10.1% to 25,690 and 24% share vs. 28% and HEV are up 7.8% to 10,585 and 9.9% share vs. 8.7%.
In the brands charts, Volvo (+12.1%) once again lodges a strong performance with 20.5% share vs. 18.5% so far this year. Volkswagen (-8.5%) falls slightly slower than the market to 11% share just as Toyota (+10.5%) and most impressively Mercedes (+42.6%) shine. Peugeot (+27.4%) is the only remaining Top 10 brand in positive with Tesla (-56.2%) imploding and Audi (-35%), Skoda (-30.8%), Kia (-20.9%) and BMW (-15.6%) all in great difficulty. Cupra (+91.5%) excels at #11 with Seat (+54.4%), Subaru (+35%) and Dacia (+30.9%) also very dynamic.
Model-wise, the Volvo XC60 (+49.6%) is a distant leader at 4% share and slips into the YTD top spot as a result. The Volvo XC40 (-31.7%) suffers at #2 but not as much as the Tesla Model Y (-55.6%) cratering at #3 and losing its YTD pole position. The Volvo S/V60 (+53.6%) is also very solid at #4 and Volvo plates four models in the Top 4 as it did last month with the EX30 at #5. Notice also the outstanding performances of the VW Tiguan (+215.8%), Toyota Corolla Cross (+178.6%) and Peugeot 3008 (+177.3%).
Previous month: Sweden April 2024: Volvo places 4 models in Top 5, sales up 6.7%
One year ago: Sweden May 2023: Tesla Model Y #1, Polestar 2 up to #5
Full May 2024 Top 58 All brands and Top 284 All models below.
Sweden May 2024 – brands:
PosBrandMay-24%/23Apr2024%/23PosFY231Volvo5,10120.3%+ 12.1%119,79818.5%+ 17.0%112Volkswagen2,74811.0%– 8.5%210,64410.0%– 7.9%223Toyota 2,4899.9%+ 10.5%39,5178.9%– 0.3%344Mercedes 1,8197.2%+ 42.6%56,6006.2%+ 15.4%585Kia 1,6346.5%– 20.9%47,7767.3%– 16.4%436BMW 1,2104.8%– 15.6%65,3895.0%– 17.2%877Audi 1,0874.3%– 35.0%75,6415.3%– 16.9%768Tesla1,0864.3%– 56.2%86,4496.0%– 18.4%659Skoda 9944.0%– 30.8%94,2083.9%– 17.3%9910Peugeot 9393.7%+ 27.4%103,7343.5%+ 13.9%101011Cupra5612.2%+ 91.5%121,9281.8%+ 90.5%121612Ford 4501.8%– 42.7%112,5472.4%– 14.6%111213Polestar4411.8%– 36.5%131,8101.7%+ 35.2%131814Porsche3581.4%+ 6.5%141,6211.5%+ 13.4%152215Renault3521.4%– 25.6%241,5901.5%– 26.0%171316Subaru 3511.4%+ 35.0%161,6411.5%+ 42.7%142317Dacia3261.3%+ 30.9%191,0971.0%– 14.9%212118Hyundai 3121.2%– 32.0%171,5921.5%– 24.7%161419Citroen 3061.2%– 1.9%201,0721.0%– 21.2%231720MG3021.2%– 71.4%211,1601.1%– 62.8%201121Seat2641.1%+ 54.4%151,3491.3%+ 28.0%192622Nissan 2451.0%– 23.9%251,3951.3%– 26.7%181523Opel 2340.9%– 40.3%239470.9%– 15.7%252424Lynk & Co2090.8%+ 1.5%285040.5%– 35.9%293025Fiat 1880.7%– 33.8%315330.5%– 40.9%282726Mazda 1770.7%+ 37.2%181,0050.9%– 43.5%242027Suzuki 1620.6%+ 37.3%268760.8%+ 105.6%262928Lexus1490.6%– 36.3%221,0971.0%+ 24.1%222529Honda 1190.5%+ 95.1%275970.6%+ 124.4%273130BYD1050.4%– 27.6%304190.4%+ 1.0%301931Zeekr630.3%new332550.2%new33 –32Mini 620.2%– 69.6%293590.3%– 59.8%312833Mitsubishi490.2%– 26.9%342890.3%+ 4.3%323234Xpeng440.2%new322200.2%new353635Land Rover350.1%+ 20.7%352240.2%+ 51.4%343436NIO180.1%– 10.0%36600.1%– 20.0%373837Fisker150.1%new44220.0%new46 –38Lotus120.0%new50220.0%new474939Ferrari70.0%– 22.2%42260.0%– 23.5%434240Chevrolet 70.0%– 30.0%47210.0%– 27.6%484341Ora60.0%– 50.0%38620.1%+ 31.9%363342Alfa Romeo60.0%– 82.9%43230.0%– 86.1%443743Lamborghini50.0%– 16.7%45270.0%– 3.6%424544Ineos40.0%new41320.0%new394745Jaguar40.0%+ 300.0%48280.0%+ 3.7%404446DS40.0%– 94.8%46220.0%– 89.0%453547McLaren40.0%+ 0.0%51130.0%+ 18.2%505048Hongqi30.0%– 25.0%39420.0%+ 44.8%384149Maxus30.0%– 57.1%40280.0%– 60.6%414050Iveco30.0%– 25.0%5360.0%– 64.7%524651Smart20.0%+ 100.0%37170.0%+ 750.0%495352SsangYong20.0%n/a5290.0%n/a515853Aston Martin20.0%n/a5640.0%n/a56 –54Cadillac20.0%n/a –20.0%– 71.4%605155Maserati10.0%+ 0.0%4950.0%+ 400.0%546056Alpine10.0%n/a5740.0%+ 100.0%555457Jeep10.0%– 98.1%5430.0%– 96.4%573958Geely10.0%new5920.0%new58 –
Sweden May 2024 – models:
PosModelMay-24%/23Apr2024%/23PosFY231Volvo XC601,6626.6%+ 49.6%16,0435.7%+ 34.1%132Volvo XC409974.0%– 31.7%43,7723.5%– 32.5%323Tesla Model Y8443.4%– 55.6%25,2674.9%– 14.6%214Volvo S/V607913.2%+ 53.6%53,5703.3%+ 52.7%485Volvo EX307723.1%new32,8142.6%new52206Toyota RAV46162.5%+ 14.3%62,5462.4%+ 36.6%677VW Tiguan5812.3%+ 215.8%191,5991.5%+ 113.8%10278VW ID.44801.9%– 42.7%171,5571.5%– 54.1%1149Toyota Corolla Cross4291.7%+ 178.6%231,2451.2%+ 21.9%173410Peugeot 30084271.7%+ 177.3%221,3871.3%+ 64.1%133611Polestar 24111.6%– 40.9%91,7431.6%+ 30.2%81612VW Passat3631.4%– 1.4%701,2041.1%+ 27.5%222813Toyota Corolla3571.4%+ 21.4%101,4481.4%+ 2.0%121514Volvo C403501.4%– 37.1%341,3281.2%– 19.9%161915Kia Sportage3461.4%– 5.5%81,7151.6%– 4.3%9916Kia Ceed3361.3%– 9.7%72,1462.0%+ 7.8%71017Cupra Born3361.3%+ 121.1%161,0511.0%+ 108.5%275518Toyota Yaris Cross3321.3%+ 16.1%271,2421.2%– 28.2%181819Mercedes E Class3161.3%+ 109.3%261,1071.0%+ 75.7%265420Kia Niro3151.3%– 45.7%121,2401.2%– 45.8%19621Skoda Octavia2841.1%– 4.7%281,0211.0%+ 5.4%283322Toyota C-HR2841.1%+ 108.8%419460.9%– 5.7%324023Volvo XC902781.1%– 14.5%211,1521.1%+ 9.9%243124Kia EV92741.1%new389250.9%new3310525Toyota Yaris2721.1%– 35.8%251,2241.1%– 11.9%201726Tesla Model 3 2380.9%+ 26.6%311,1221.0%– 10.5%252127VW ID.32250.9%– 33.2%149530.9%– 22.5%312628VW ID.72250.9%new823720.3%new7720229Subaru Outback2200.9%+ 24.3%291,2101.1%+ 47.7%213730Audi Q4 E-Tron2130.8%– 45.0%131,3421.3%+ 17.6%141131Lynk & Co 012090.8%+ 1.5%405040.5%– 35.9%625732BMW X12070.8%– 21.0%248690.8%– 20.3%353033Audi A32010.8%– 29.7%359790.9%– 15.3%302434Peugeot 50081980.8%+ 175.0%369970.9%+ 202.1%297135Skoda Enyaq1940.8%– 62.5%428680.8%– 48.2%37536VW T-Roc1890.8%– 5.0%111,2041.1%+ 16.2%232237Volvo S/V901870.7%– 65.1%448730.8%– 44.1%341338Dacia Sandero1860.7%+ 10.7%476280.6%+ 14.8%516939MG 41850.7%– 33.0%375450.5%– 17.8%572940Mercedes C Class1840.7%+ 34.3%466540.6%– 17.0%483941VW Golf1770.7%– 47.0%181,3361.2%+ 15.5%152542Audi A61770.7%– 29.8%398250.8%– 27.2%382343Skoda Kodiaq1770.7%+ 18.0%507010.7%+ 17.6%445844Fiat Ducato1770.7%– 11.1%1034010.4%– 35.3%736145BMW 3-Series1680.7%+ 71.4%456890.6%– 13.7%454546Peugeot 3081650.7%– 38.9%723790.4%– 43.0%758147Nissan Qashqai1620.6%+ 27.6%625270.5%– 36.8%594148Mercedes GLE1600.6%+ 61.6%784570.4%+ 80.6%6410049Mercedes EQB1570.6%+ 175.4%336540.6%+ 135.3%498550Seat Arona1540.6%+ 65.6%207340.7%+ 41.4%428451Kia EV61500.6%– 61.2%327500.7%– 62.4%411252Mercedes GLC1430.6%– 10.6%526710.6%– 5.8%474353Skoda Superb1430.6%– 5.3%802960.3%– 30.8%919354BMW 5-Series1310.5%+ 4.8%487170.7%– 11.8%434655Citroen C3 Aircross1300.5%n/a632680.3%n/a98 –56Porsche Cayenne1290.5%+ 37.2%307870.7%+ 87.8%399757BMW i51160.5%new1442340.2%new10617258Ford Focus1150.5%– 1.7%717630.7%– 21.7%404259Mercedes EQA1140.5%+ 26.7%914020.4%+ 22.2%728860BMW X31120.4%– 47.9%565680.5%– 29.9%565261Cupra Formentor1120.4%+ 31.8%543650.3%– 10.3%806762Audi Q31110.4%+ 7.8%664890.5%+ 7.2%637963Dacia Duster1110.4%+ 117.6%553700.3%– 29.9%796864Mercedes EQE1070.4%+ 44.6%436790.6%+ 47.3%464865Porsche 9111070.4%– 7.0%493540.3%+ 16.8%8210866BMW X51060.4%+ 34.2%515160.5%+ 94.0%609167Kia Stonic1060.4%+ 2.9%973220.3%– 13.0%869268Mercedes CLA1040.4%+ 3.0%1043010.3%– 37.9%907669MG ZS1030.4%+ 6.2%842270.2%– 45.3%1088270Ford Tourneo Custom1000.4%n/a2011250.1%+ 1983.3%15017571Mercedes Sprinter990.4%+ 25.3%1282720.3%+ 7.1%9611372BMW i4980.4%– 70.4%696150.6%– 48.7%531473VW T-Cross 940.4%+ 46.9%616010.6%+ 37.8%548074Skoda Fabia940.4%+ 49.2%814470.4%+ 27.7%659975Seat Leon940.4%+ 261.5%644260.4%+ 419.5%6711776Opel Astra940.4%+ 38.2%1361390.1%– 4.1%14115277Audi A4920.4%– 47.1%754180.4%– 36.5%687578VW Taigo880.4%– 32.8%935280.5%– 16.5%586379Mazda CX-60870.3%+ 85.1%575110.5%– 30.7%615680Mercedes GLA870.3%+ 33.8%1092680.3%+ 8.1%9911681Toyota Aygo X870.3%+ 35.9%1022050.2%– 37.5%11810482Citroen C4860.3%– 60.9%943710.3%– 31.8%785183Cupra Leon850.3%+ 57.4%583520.3%+ 116.0%838684VW Multivan850.3%– 15.8%872530.2%– 20.7%10210785Ford Puma 840.3%+ 58.5%833260.3%+ 152.7%859886Mercedes V Class810.3%+ 179.3%1722090.2%+ 1.0%11613487Audi Q2790.3%– 18.6%953780.4%– 15.2%768988Opel Mokka780.3%– 67.2%734340.4%– 25.9%665989Lexus NX770.3%– 32.5%606200.6%+ 61.9%526590Skoda Kamiq760.3%– 52.2%536320.6%+ 14.5%507091Peugeot 2008760.3%+ 76.7%595890.6%+ 16.4%556092Hyundai i10740.3%+ 76.2%982650.2%– 12.3%10011293Mercedes GLB740.3%+ 80.5%1501760.2%– 4.9%13013594Renault Austral730.3%+ 15.9%1413140.3%+ 398.4%8816295Audi A1720.3%+ 89.5%1291540.1%– 36.1%13412196Suzuki S-Cross710.3%+ 273.7%863150.3%+ 253.9%8714197Renault Clio680.3%– 46.9%1064130.4%– 16.4%704998Subaru Crosstrek610.2%new1521430.1%new14032099Kia Sorento590.2%– 58.7%763850.4%– 12.5%7464100Hyundai Kona590.2%– 42.2%1002800.3%– 2.4%9594101VW Caddy590.2%+ 40.5%1012100.2%+ 26.5%115124102VW ID.Buzz580.2%– 54.3%1191990.2%– 44.6%12190103Renault Scenic580.2%#DIV/0! –620.1%#DIV/0!188 –104Opel Grandland X560.2%+ 124.0%743560.3%+ 287.0%81118105Zeekr 001560.2%new1332300.2%new107 –106BMW 1-Series530.2%+ 51.4%1082430.2%– 16.8%104123107Suzuki Swift510.2%+ 131.8%1052460.2%+ 153.6%103155108Ford Transit510.2%– 7.3%1572110.2%+ 32.7%111127109BMW 2-Series500.2%– 46.8%1072190.2%– 53.0%11095110BMW IX2490.2%new881900.2%new125 –111Ford Kuga480.2%– 89.7%158680.8%– 28.1%3632112Kia Picanto480.2%– 48.9%902890.3%– 13.2%9387113Honda E:NY1480.2%new652870.3%new94237114Mini Hatch460.2%– 73.7%792270.2%– 68.9%10950115Audi e-Tron450.2%– 67.6%674070.4%– 30.3%7138116Mitsubishi Eclipse Cross450.2%+ 150.0%1551280.1%+ 28.0%147151117Renault Captur440.2%– 55.1%1203390.3%– 0.3%8466118Porsche Macan440.2%+ 12.8%891990.2%– 15.3%120120119Citroen C3440.2%+ 18.9%1261940.2%– 24.2%124103120BMW iX420.2%– 58.4%1152100.2%– 36.6%11396121Xpeng G9420.2%new962010.2%new119174122Hyundai Bayon420.2%+ 110.0%1121700.2%+ 36.0%131130123Renault Megane 420.2%– 64.7%1271260.1%– 84.7%14962124Porsche Taycan420.2%– 19.2%189910.1%– 70.6%167102125Subaru Forester410.2%+ 28.1%1181950.2%+ 37.3%123157126Toyota bZ4X400.2%– 86.9%993070.3%– 43.1%8974127Renault Master400.2%+ 400.0%1701250.1%+ 220.5%151183128Hyundai Ioniq 5390.2%+ 39.3%1342050.2%– 28.6%11783129Mercedes A Class390.2%– 40.0%1641120.1%– 64.4%155106130BYD Atto 3380.2%– 73.0%922100.2%– 43.7%11420131Citroen C5 Aircross370.1%+ 94.7%1141900.2%– 58.3%12678132Audi A5350.1%– 14.6%1251340.1%– 49.4%144128133Toyota Verso350.1%n/a228720.1%+ 1700.0%178268134VW ID.5340.1%– 75.4%1241960.2%– 64.6%12247135Nissan X-Trail340.1%+ 88.9%1401500.1%+ 10.3%136133136Ford Mustang Mach-E340.1%+ 161.5%1101350.1%+ 27.4%143129137VW Crafter340.1%+ 142.9%165980.1%+ 18.1%164180138Hyundai Tucson310.1%– 83.4%852920.3%– 57.7%9253139Audi Q5300.1%– 55.9%1562690.3%– 29.8%9773140Porsche 718300.1%+ 20.0%1171500.1%+ 120.6%137182141Dacia Jogger290.1%– 3.3%151990.1%– 53.7%162125142Peugeot 408280.1%– 36.4%1112110.2%+ 48.6%112150143Cupra Ateca280.1%+ 1300.0%1301600.1%+ 451.7%133185144Polestar 3270.1%new153480.0%new194 –145Skoda Karoq260.1%– 62.3%771860.2%– 42.2%128111146Nissan Juke260.1%+ 333.3%1231540.1%+ 600.0%135173147Toyota Camry 260.1%+ 52.9%1321460.1%+ 21.7%139154148Mazda CX-30260.1%– 21.2%1161380.1%– 46.5%142122149VW Caravelle260.1%– 46.9%139830.1%– 53.1%170131150BYD Seal U260.1%new281280.0%new220 –151Suzuki Vitara250.1%– 51.9%1222430.2%+ 66.4%105110152Mercedes GLS250.1%+ 78.6%1351670.2%+ 92.0%132186153Hyundai i20250.1%– 35.9%1591020.1%– 53.6%160138154BMW X7250.1%– 3.8%1371010.1%+ 23.2%161177155Lexus LBX250.1%new158740.1%new175 –156Lexus RX240.1%– 29.4%1431320.1%+ 17.9%145147157Mercedes Vito230.1%+ 91.7%1311030.1%+ 56.1%159176158Subaru Solterra230.1%– 20.7%113980.1%+ 25.6%163192159Mercedes Citan230.1%+ 91.7%211810.1%+ 76.1%173184160Mazda MX5220.1%+ 266.7%248300.0%– 18.9%216231161VW Touareg210.1%+ 40.0%1211870.2%+ 96.8%127109162Mercedes CLE210.1%new162690.1%new180266163Lexus ES/IS/LS/RC190.1%– 40.6%1491300.1%– 41.7%146119164BYD Dolphin190.1%new142950.1%new165262165Honda HR-V190.1%+ 216.7%196610.1%+ 60.5%189164166Peugeot 208170.1%– 87.2%154820.1%– 88.4%17277167BMW 4-Series170.1%– 43.3%169630.1%– 58.8%185169168Mercedes B Class170.1%+ 88.9%218280.0%– 3.4%222211169Hyundai i30160.1%+ 6.7%166860.1%– 30.1%169156170Honda Civic160.1%+ 6.7%147800.1%+ 73.9%174208171Mercedes AMG GT160.1%+ 33.3%190450.0%+ 9.8%198221172Mazda2150.1%– 16.7%681760.2%– 29.6%129126173Fisker Ocean150.1%new205730.1%new176 –174Honda CR-V150.1%+ 275.0%212660.1%+ 153.8%181213175Honda Jazz150.1%– 57.1%176650.1%– 56.7%182158176Nissan Ariya140.1%– 46.2%1781260.1%+ 15.6%148140177Range Rover 140.1%+ 16.7%2231080.1%+ 285.7%156197178BYD Seal140.1%new184640.1%new183272179Hyundai Santa Fe140.1%– 46.2%186470.0%– 11.3%195193180Peugeot 508140.1%+ 1300.0%233240.0%+ 71.4%232250181Audi Q8130.1%– 61.8%1601460.1%+ 30.4%138144182MG 5130.1%– 95.3%2441180.1%– 89.8%15344183Suzuki Swace130.1%– 31.6%193610.1%– 20.8%192187184Seat Ibiza120.0%– 29.4%1711150.1%– 43.6%154137185Mini Countryman120.0%– 58.6%1381040.1%– 35.0%158148186Land Rover Defender120.0%+ 200.0%197610.1%– 9.0%190196187Renault Kangoo110.0%– 31.3%217730.1%+ 1.4%177178188Hyundai Ioniq 6110.0%n/a213420.0%+ 55.6%202194189Mercedes CL class110.0%n/a206410.0%+ 7.9%204210190Mercedes EQS100.0%– 66.7%194300.0%– 73.0%217179191Toyota Proace Verso90.0%– 64.0%1731190.1%+ 91.9%152165192Fiat 50090.0%– 75.7%1611040.1%– 18.8%157159193Mazda MX-3090.0%– 10.0%181630.1%– 79.7%186136194Mazda390.0%+ 80.0%174450.0%– 48.9%197188195Mazda CX-590.0%– 10.0%198420.0%– 54.8%203189196Citroen Jumper90.0%– 57.1%262270.0%– 37.2%224203197Nissan Leaf80.0%– 94.0%1634170.4%– 40.4%6935198Peugeot Expert80.0%+ 300.0%259170.0%– 15.0%243222199Mercedes G Class70.0%– 70.8%203640.1%– 20.0%184168200Ford Courier70.0%n/a229340.0%n/a209 –201NIO ET770.0%– 41.7%200270.0%– 25.0%225214202Audi A770.0%+ 133.3%224250.0%+ 0.0%228227203Zeekr X70.0%new221250.0%new231 –204Lotus Eletre70.0%new240160.0%new248282205Subaru XV60.0%– 72.7%177950.1%– 14.4%166143206Ora Funky Cat60.0%– 50.0%179620.1%+ 31.9%187101207Renault Trafic60.0%– 66.7%195460.0%+ 4.5%196163208Porsche Panamera60.0%– 45.5%215400.0%– 57.9%205167209BMW X460.0%+ 20.0%199370.0%+ 0.0%206225210Ford Tourneo Connect60.0%– 50.0%167360.0%– 40.0%207204211Honda ZR-V60.0%new175350.0%new208223212BMW X660.0%+ 20.0%210300.0%– 11.8%215216213Renault Espace60.0%n/a237300.0%n/a218233214Ferrari 29660.0%new222110.0%new255 –215Renault Arkana50.0%– 50.0%148610.1%– 60.6%191145216Audi Q750.0%– 86.8%246320.0%– 74.2%211160217VW Arteon50.0%– 86.8%258310.0%– 76.3%214153218Alfa Romeo Tonale50.0%– 85.3%192200.0%– 79.8%235190219BMW 7-Series50.0%+ 150.0%227180.0%+ 350.0%238279220BYD Tang50.0%+ 400.0% –170.0%+ 142.9%241228221Range Rover Velar50.0%+ 150.0%264160.0%– 36.0%249242222Peugeot Boxer50.0%+ 25.0% –150.0%+ 7.1%250246223NIO EL750.0%+ 66.7% –110.0%– 56.0%258248224BMW 8-Series50.0%+ 0.0%27790.0%– 10.0%263277225Lotus Emira50.0%n/a –60.0%n/a276 –226Lexus UX EV40.0%– 89.2%145880.1%– 35.8%168146227Seat Tarraco40.0%– 33.3%146710.1%+ 44.9%179198228Ineos Grenadier40.0%new188320.0%new212249229VW Kombi40.0%– 20.0%261290.0%– 35.6%219199230Mini Clubman40.0%n/a236280.0%+ 1300.0%223218231BMW i740.0%+ 33.3%226160.0%– 64.4%244232232BMW Z440.0%+ 0.0%187160.0%– 5.9%245263233McLaren40.0%+ 0.0%271110.0%+ 0.0%256286234NIO ET540.0%– 20.0%249110.0%– 21.4%259239235DS 740.0%– 50.0% –100.0%– 64.3%262234236Opel Zafira40.0%– 50.0%25180.0%– 52.9%266254237Lamborghini Huracan40.0%n/a24370.0%n/a270 –238Chevrolet Corvette40.0%– 50.0%26760.0%– 64.7%274261239Ford Mustang40.0%– 78.9% –40.0%– 94.2%288209240Mitsubishi ASX30.0%– 72.7% –820.1%+ 57.7%171215241Hongqi E-HS930.0%– 25.0%182420.0%+ 44.8%201219242Tesla Model X30.0%– 97.6%202330.0%– 81.7%210142243Maxus Euniq30.0%– 57.1%180280.0%– 59.4%221201244BMW XM30.0%– 72.7%225210.0%+ 10.5%234206245Polestar 430.0%new168180.0%new239 –246Jaguar F-Pace30.0%n/a239160.0%+ 23.1%247264247Audi R830.0%– 25.0%232110.0%– 8.3%254269248BMW X230.0%+ 0.0%23570.0%– 79.4%269258249BYD Han30.0%+ 0.0%26960.0%– 82.9%273205250Iveco Daily30.0%– 25.0%26550.0%– 70.6%281255251Xpeng P720.0%new230190.0%new237247252Audi S620.0%– 33.3%183170.0%– 10.5%240238253Audi e-Tron GT20.0%– 60.0%268130.0%– 35.0%251226254Land Rover Discovery Sport20.0%– 33.3%250130.0%+ 62.5%252267255NIO EL620.0%new231110.0%new257298256Suzuki Across20.0%– 66.7%220110.0%– 35.3%260244257Opel Corsa20.0%– 96.2% –70.0%– 97.4%272115258Land Rover Freelander20.0%n/a28530.0%n/a293 –259Cadillac SRX20.0%n/a –20.0%– 71.4%313290260Peugeot Rifter10.0%– 92.9%266310.0%– 8.8%213212261Tesla Model S10.0%– 99.6%247270.0%– 91.1%226114262Ford Transit Custom10.0%– 94.1%185260.0%– 77.4%227171263Mitsubishi Space Star10.0%– 97.4%209250.0%– 80.0%230149264Nissan Primastar10.0%– 66.7%238200.0%– 23.1%236229265Toyota Proace City10.0%– 75.0% –110.0%– 57.7%261257266Smart #110.0%new20880.0%new267 –267Smart #310.0%new20780.0%new268 –268MG Marvel R10.0%– 99.8% –70.0%– 99.1%27172269Aston Martin DBS10.0%new27850.0%new280 –270Alpine A11010.0%n/a27440.0%+ 100.0%282299271Jaguar F-Type10.0%n/a27540.0%– 33.3%285291272Lamborghini Urus10.0%new25630.0%new292 –273Maserati10.0%+ 0.0%25330.0%+ 200.0%294314274Toyota Mirai10.0%n/a –30.0%+ 50.0%297315275Alfa Romeo Stelvio10.0%n/a –20.0%– 94.1%298251276Aston Martin DB1210.0%new28920.0%new299 –277Fiat 60010.0%new28720.0%new303 –278Jeep Avenger10.0%new28220.0%new306276279Mercedes EQT10.0%new28320.0%new308273280SsangYong Korando10.0%n/a28420.0%n/a310 –281Ferrari Portofino10.0%n/a –10.0%+ 0.0%329296282Ssangyong Torres10.0%new –10.0%new330326283Hyundai Nexo10.0%n/a –10.0%n/a331 –284Fiat Abarth10.0%n/a –10.0%n/a332 –
Source: Mobility Sweden

More Stories
What to Look for When Choosing a Luxury Car Rental
There was a time when sliding behind the wheel of a Rolls-Royce, a Bentley or a high-end performance car meant...
Ferrari Denies Claims That Buyers Must Order the Luce EV to Get Higher Models
Ferrari’s first fully electric vehicle, the Luce, has already become one of the most talked-about cars to come out of...
China new models May 2026: Audi E7X and Onvo L80 appear
Onvo L80 Now that May 2026 has been studied, let’s focus on the latest launches on the Chinese market. Once...
World Full Year 2025: Discover the Top 500 best-selling models (BSCB Exclusive)
This content is for members only. Visit the site and log in/register to read.
McLaren Marks a Historic Milestone with a Special Artura
McLaren Automotive has revealed a striking new limited-edition model: the McLaren Artura 1000GP by MSO. Created to celebrate McLaren Racing’s...
The ROI Equation, Fleet Longevity and Truck Parts Quality
The math of fleet management has changed. For years, deciding to replace an aging tractor was mainly about mileage, age,...