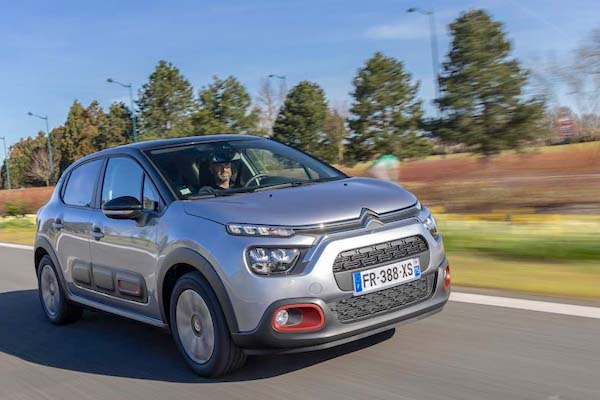
Italy May 2024: Negative market, Fiat hits lowest ever share, Citroen C3 up to #2
Citroen C3 sales are up 140.5% year-on-year in May.
The Italian new car market hits the brakes in April at -6.6% year-on-year to 139,581 units, 10,000 less than in May 2023. The year-to-date tally remains in positive however at +3.4% to 726,311. Note this is still -20.2% below the first five months of pre-pandemic 2019. Worryingly, private sales (-10.8%) fall faster than the market to 72,352 units and 51.2% share vs. 53.5% a year ago. Self-registrations sure 39.1% to 17,703, long term leases skid -18.6% to 31,573 but short-term rentals gain 9.8% to 11,518. Company sales are down -5% to 8,043. Year-to-date, private sales are up 4.3% to 54% share vs. 53.5% over the same period in 2023, self-registrations are up 24.7%, long term leases down -15.7%, short term rentals up 46.7% and company sales up 1.4%.
In terms of alimentation, for May petrol is up 6.7% to 45,395 and 32.2% share vs. 28.1% in May 2023, diesel drops -31.1% to 20,393 and 14.4% share vs. 19.5% and LPG sinks -33.2% to 9,007. HEVs are up 7.7% to 56,640 and 40.1% share vs. 34.7% a year ago, including 16,004 full hybrids (+2.7%) and 40,636 mild hybrids (+9.8%). PHEVs tumble down -34.9% to 4,598 while BEVs fall -18.3% to just 5,070 units and 3.6% share vs. 4.1% in May 2023. Year-to-date, petrol is up 16.9% to 230.271 and 31.3% share vs. 27.7% over the first 5 months of 2023, diesel is down -21.3% to 109,803, LPG down -1.1% to 62,942, HEVs up 13.8% to 286,197 with full hybrids up 16.5% and mild hybrids up 12.8%, PHEVs are off -26.8% to 23,585 and BEVs dow -18.7% to 21,675 and 2.9% share vs. 3.8% last year.
Over in the brands ranking, Fiat (-11.8%) is in perdition again and hits rock bottom: its lowest ever share at home at 9.3%. Previous lowest was 9.4% less than a year ago in June 2023. In contrast Volkswagen (+3.6%) at 8.2% and Toyota (+4.4%) at 8% catch up. Renault (+20.6%) is in excellent shape at #4 with 5.9% share, as is Audi (+5.9%) up five spots on April to #5 overall. Jeep (-4.7%) is also up five ranks to #6, distancing Peugeot (-38.5%) in great difficulty. Citroen (+42.5%) lodges the largest gain in the Top 10 at #10 with BMW (+21.2%) also very dynamic. Below, Mitsubishi (+884.5%), Nissan (+36.4%), Land Rover (+25.6%) and MG (+22.3%) all impress.
Model-wise, the Fiat Panda (+12.3%) goes against the market with a double-digit year-on-year gain but is the only Fiat in the Top 22! Like in Spain, the Citroen C3 (+140.5%) is boosted by rushed sales of the outgoing generation that doesn’t comply with new European safety regulations. It is up to #2 for the month and #3 year-to-date. Awaiting the new generation, the Lancia Ypsilon (-18.7%) tumbles down but still manages a third place vs. #4 so far this year. The Jeep Avenger (+35.1%) rallies back up 7 ranks on last month to climb to #4, equally is record ranking in Italy also reached last October, November and January. The Toyota Yaris Cross (-3.9%) is back up 10 spots on April to #4, distancing the VW T-Roc (+6.8%) and Renault Clio (+62.7%). The Dacia Sandero (-41.2%) is hit hard at #8 but stays #2 year-to-date The MG ZS (+69.1%) sports a second consecutive Top 10 finish. The Audi Q3 (+72.6%) smashes its ranking record to #13, with the VW T-Cross (+63.9%) and Kia Sportage (+24.2%) also strong.
Previous month: Italy April 2024: Sales back in positive at +7.5%, BEVs off -19.6%, Citroen C3, Toyota Yaris shine
One year ago: Italy May 2023: Fiat down to lowest ever share, Jeep Avenger up to #12
Full May 2024 Top 50 All brands and Top 50 models below.
Italy May 2024 – brands:
PosBrandMay-24%/23Apr2024%/23PosFY231Fiat12,9609.3%– 11.8%178,68210.8%– 2.5%112Volkswagen11,4908.2%+ 3.6%254,3727.5%– 4.3%323Toyota11,1848.0%+ 4.4%355,1157.6%+ 23.9%234Renault8,2325.9%+ 20.6%536,2885.0%+ 6.5%665Audi6,8104.9%+ 5.9%1031,7434.4%+ 6.2%996Jeep6,5774.7%– 4.7%1132,4414.5%– 3.9%887Peugeot6,5694.7%– 38.5%836,8815.1%– 9.1%578BMW6,4324.6%+ 21.2%731,4004.3%+ 23.8%11109Ford6,2904.5%– 25.1%633,0094.5%– 16.4%7510Citroen5,6934.1%+ 42.5%931,4904.3%+ 33.6%101111Hyundai4,7833.4%+ 9.9%1322,8053.1%+ 10.5%121312Mercedes4,7433.4%+ 12.0%1221,5113.0%– 1.0%131213Dacia4,6683.3%– 40.7%440,2865.5%+ 3.6%4414Kia4,4973.2%– 6.0%1420,5452.8%– 2.8%151415Opel4,1743.0%– 6.2%1721,4433.0%– 5.2%141616Lancia3,8272.7%– 18.6%1520,5422.8%+ 5.2%161517MG3,7032.7%+ 22.3%1617,2752.4%+ 59.1%182018Skoda3,2012.3%+ 6.2%1916,1472.2%+ 12.6%201919Nissan3,0722.2%+ 36.4%2018,4932.5%+ 24.8%171720Suzuki2,5741.8%– 34.3%1816,8472.3%+ 12.3%191821Alfa Romeo2,0011.4%– 25.3%2110,8191.5%– 6.7%212122DR Motor1,9561.4%– 37.1%227,8921.1%– 35.2%232223Volvo1,7051.2%– 18.5%258,8651.2%+ 15.4%222524Cupra1,5871.1%+ 2.5%237,7451.1%+ 21.6%242425Seat1,4021.0%+ 7.2%246,7260.9%+ 19.3%252826Mazda1,1560.8%+ 1.6%286,3530.9%– 8.7%262727Mini1,1040.8%– 44.7%266,0420.8%– 31.2%272328Land Rover1,0790.8%+ 25.6%274,5960.6%+ 18.6%292929Tesla1,0730.8%– 27.4%355,1380.7%– 24.1%282630Mitsubishi8270.6%+ 884.5%322,1370.3%+ 225.8%344031Porsche7180.5%+ 4.7%294,1570.6%+ 23.8%303032EVO5360.4%– 4.6%332,5760.4%+ 26.4%333133Honda5180.4%+ 9.5%303,2970.5%+ 38.8%313334DS4800.3%– 53.4%312,7420.4%– 26.1%323235Lexus4150.3%– 27.2%342,0620.3%+ 32.0%353636Smart2780.2%– 31.4%361,4590.2%– 30.6%363437Maserati2280.2%– 38.9%371,2310.2%– 29.6%373538Subaru1570.1%– 24.2%416430.1%– 45.3%383839SsangYong1460.1%+ 942.9%473120.0%+ 126.1%444540Lynk & Co1400.1%– 67.1%425000.1%– 81.2%423741EMC1060.1%+ 221.2%385580.1%+ 80.6%40n/a42Jaguar750.1%– 67.1%405520.1%– 21.1%413943Ferrari600.0%– 4.8%433500.0%+ 2.0%434344Lamborghini560.0%+ 14.3%462240.0%+ 15.5%464445BYD520.0%+ 147.6%442670.0%+ 1171.4%45n/a46Lotus330.0%+ 106.2%451530.0%+ 183.3%474647Sportequipe250.0%– 37.5%396420.1%+ 1111.3%39n/a48Polestar220.0%– 75.8%49700.0%– 83.9%494149Mahindra200.0%– 85.8%481260.0%– 63.7%484250Aston Martin50.0%– 50.0%50440.0%+ 2.3%5047 –Others1420.1%+ 43.4% –7180.1%+ 134.6% – –
Italy May 2024 – models:
PosModelMay-24%/23Apr2024%/23PosFY231Fiat Panda8,8066.3%+ 12.3%153,4397.4%+ 21.9%112Citroen C34,1973.0%+ 140.5%421,6603.0%+ 83.9%383Lancia Ypsilon3,8242.7%– 18.7%320,5392.8%+ 5.2%434Jeep Avenger3,7562.7%+ 35.1%1116,9402.3%+ 213.2%5185Toyota Yaris Cross3,3292.4%– 3.9%1516,2082.2%– 3.4%646VW T-Roc3,2272.3%+ 6.8%1014,2562.0%– 4.7%1067Renault Clio3,1952.3%+ 62.7%714,3272.0%+ 36.3%8138Dacia Sandero3,0982.2%– 41.4%226,1663.6%+ 21.2%229MG ZS2,8512.0%+ 69.1%912,9851.8%+ 137.7%132210Toyota Yaris2,7902.0%– 14.5%514,7472.0%+ 30.7%71611Renault Captur2,6411.9%– 9.2%1213,3261.8%– 2.6%12712Opel Corsa2,5841.9%+ 14.3%1810,6421.5%– 11.2%171713Audi Q32,5021.8%+ 72.6%247,8131.1%+ 7.3%253114VW T-Cross2,4231.7%+ 63.9%1310,8061.5%+ 9.9%162015Kia Sportage2,3131.7%+ 24.2%1910,2161.4%+ 24.4%192316Peugeot 2082,3031.6%– 5.7%814,2902.0%+ 45.8%91417Ford Puma2,2521.6%– 33.8%613,5051.9%+ 3.2%11918Toyota Aygo X2,1991.6%+ 93.7%209,5681.3%+ 93.5%223019Hyundai i101,9541.4%+ 74.6%487,0131.0%+ 20.8%283320Nissan Qashqai1,8411.3%+ 42.4%2710,0581.4%+ 21.9%212121VW Tiguan1,8301.3%+ 14.7%216,6140.9%– 21.1%312822Peugeot 20081,8021.3%– 39.8%2911,5501.6%+ 21.1%151523Fiat 5001,6371.2%– 35.0%1610,4421.4%– 40.7%18524Jeep Compass1,5581.1%– 20.1%287,7581.1%– 34.4%261925BMW X11,5571.1%+ 25.5%238,1341.1%+ 53.6%243226Toyota C-HR1,4891.1%+ 28.7%396,6160.9%+ 31.3%30n/a27Alfa Romeo Tonale1,4811.1%– 25.5%227,7181.1%– 7.5%272528Peugeot 30081,4441.0%– 59.8%n/a5,3640.7%– 58.5%402429VW Polo1,4191.0%+ 3.4%406,9461.0%– 5.8%292630Ford Kuga1,3711.0%– 13.2%426,5810.9%– 26.8%322731Jeep Renegade1,3541.0%– 47.6%308,2681.1%– 52.6%231132Dacia Duster1,3341.0%– 35.1%1412,0041.7%– 14.1%141033Fiat 500X1,2190.9%– 60.1%1710,1641.4%– 27.0%201234Kia Picanto1,1540.8%– 2.7%494,5140.6%– 13.7%473935Ford Focus1,1250.8%– 30.6%326,0090.8%– 30.6%362936Mercedes GLA1,1040.8%+ 39.9%345,9730.8%+ 22.0%373737Citroen C3 Aircross1,0990.8%+ 1.5%256,4810.9%– 4.7%333538DR 5.01,0710.8%+ 8.1%35n/an/an/an/an/a39Skoda Fabia1,0560.8%n/an/a4,1600.6%n/a48n/a40Audi A11,0300.7%+ 27.2%n/an/an/an/an/a4741Hyundai Tucson1,0130.7%– 22.4%454,9130.7%– 31.5%443442Cupra Formentor9830.7%– 22.2%384,7420.7%– 8.8%453643VW Golf9730.7%– 35.6%415,4020.7%– 3.5%394544Audi A39660.7%– 7.7%316,1300.8%+ 35.2%354145Nissan Juke9600.7%n/a446,2240.9%n/a344046Hyundai i209290.7%n/a265,1780.7%n/a41n/a47Volvo XC408610.6%– 20.3%n/an/an/an/an/an/a48Renault Austral7820.6%n/a50n/an/an/an/a4649Suzuki Ignis7730.6%– 38.3%n/a4,6380.6%+ 10.0%464350Ford Tourneo Courier7600.5%n/a473,0990.4%n/an/an/an/aSuzuki Vitara7180.5%n/a335,1310.7%n/a4250n/aBMW Serie 17140.5%– 13.3%434,0080.6%– 10.1%50n/an/aVW Taigo6880.5%– 7.9%365,4070.7%+ 9.8%3849n/aTesla Model 36820.5%+ 3.2%n/a2,0620.3%– 7.6%n/an/an/aOpel Mokka4870.3%– 55.8%n/a4,9840.7%– 13.5%4342n/aAudi Q24670.3%n/an/a4,0380.6%n/a49n/an/aTesla Model Y3780.3%– 48.0%n/a2,9600.4%– 28.9%n/an/a
Source: UNRAE


