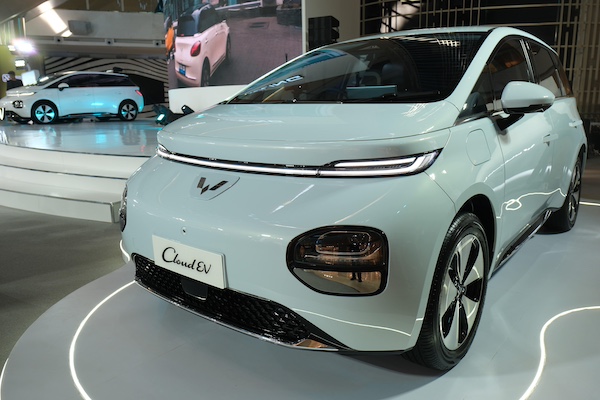
Indonesia April 2024: Daihatsu Sigra and Toyota Rush on top, Wuling Cloud lands
The Wuling Cloud ranks #24 this month in Indonesia.
The Indonesian new vehicle wholesales market dive -17.4% year-on-year in April to just 48,637 units. This is dreadful result as April 2023 sales were already down -28.9% on the year prior. The year-to-date volume is now off -22.7% to 263,706. As for retail sales, they are down -14.2% to 58,779 for the month and -14.8% year-to-date to 289,551.
In the wholesales brands ranking, Toyota (-29.4%) suffers but its market share, at 31.3%, is above its YTD level of 30.7%. Daihatsu (-12%) limits its fall somewhat, while Suzuki (+6.8%) swims upstream with a year-on-year lift, distancing Honda (-6.9%) and Mitsubishi (-34.7%). Mitsubishi Fuso (+31%), Hino (+8.6%) and Wuling (+1.5%) also post upticks in the remainder of the Top 10, while Chery (+14.6%) and most strikingly MG (+505%) soar.
Retail-wise, Toyota (-18.9%), Daihatsu (-11.3%), Honda (-21.1%) and Mitsubishi (-15.9%) all drop year-on-year, followed by Suzuki (+1.7%), Mitsubishi Fuso (+2.7%) and Isuzu (+20.8%) all up. MG (+516.1%) and Chery (+84.8%) also surge.
Over in the models lane, the Daihatsu Sigra (+41.7%) is #1 for the 4th month in a row with a dominant 7.7% share. Year-to-date, it increases its advantage over the #2, the Honda Brio (+201.2%) to 3,524 units. The Toyota Rush (+43.9%) climbs up 9 spots on March to land in 2nd place, which is its highest ranking since October 2022 (also #2). The Toyota Kijang Innova (-23%), Avanza (-30.1%) and Suzuki Carry Pikap (-27.1%) all crater. The Wuling Cloud lands directly at #24.
Previous month: Indonesia March 2024: Daihatsu Sigra, Toyota Kijang Innova defy sinking market
One year ago: Indonesia April 2023: Mitsubishi Xpander #1, Toyota Avanza now #1 YTD, sales sink -28.9%
Full April 2024 Top 30 All brands (wholesales and retail) and Top 152 All models (wholesales) below.
Note: The brands rankings include medium and heavy commercial vehicles but the models ranking does not.
Indonesia April 2024 – brands (wholesales):
PosBrandApr-24%/23Mar2024%/23PosFY231Toyota15,20131.3%– 29.4%180,85630.7%– 24.6%112Daihatsu9,48119.5%– 12.0%255,48421.0%– 14.8%223Suzuki4,98610.3%+ 6.8%422,7878.6%– 15.9%544Honda4,6119.5%– 6.9%332,67712.4%– 37.1%335Mitsubishi4,0068.2%– 34.7%523,1158.8%– 17.7%456Mitsubishi Fuso1,9874.1%+ 31.0%68,5823.3%– 34.4%877Isuzu1,8493.8%– 8.7%78,6953.3%– 21.0%788Hyundai1,4853.1%– 33.7%98,7283.3%– 31.1%669Hino1,3192.7%+ 8.6%105,8572.2%– 34.8%10910Wuling1,1882.4%+ 1.5%86,6452.5%+ 11.3%91011Chery5901.2%+ 14.6%112,1230.8%+ 120.9%111412Mazda3910.8%– 26.9%121,3950.5%– 24.5%121213MG3590.7%+ 508.5%151,0440.4%+ 165.6%142014Lexus2470.5%– 17.7%149300.4%+ 68.8%161515BMW 2230.5%– 40.5%169840.4%– 14.7%151316Mercedes2000.4%– 39.9%131,0460.4%– 43.2%131117UD Trucks1260.3%+ 65.8%195780.2%– 12.6%171618Kia 940.2%– 16.8%174770.2%+ 13.3%181819Nissan820.2%– 48.8%184360.2%– 33.6%191720Mini580.1%+ 45.0%202560.1%+ 20.2%212121Dongfeng (DFSK)440.1%– 32.3%213350.1%– 40.3%201922Subaru280.1%– 22.2%241400.1%– 12.5%222423Scania270.1%– 62.0%231140.0%– 59.7%242224FAW230.0%+ 27.8%25970.0%+ 56.5%252325Citroen150.0%n/a221360.1%n/a23 –26Volkswagen70.0%– 30.0%26410.0%– 63.7%282627Seres50.0%new28440.0%new272928Peugeot40.0%– 78.9%29270.0%– 70.0%292729Audi10.0%– 83.3%3090.0%– 35.7%303030Neta00.0%new27690.0%new2628
Indonesia April 2024 – brands (retail):
PosBrandApr-24%/23Mar2024%/23PosFY231Toyota19,57733.3%– 18.9%192,54732.0%– 11.8%112Daihatsu12,41921.1%– 11.3%261,56621.3%– 14.0%223Honda6,50711.1%– 21.1%336,25112.5%– 21.1%334Mitsubishi5,0238.5%– 15.9%424,8158.6%– 16.2%455Suzuki5,0048.5%+ 1.7%523,8178.2%– 13.6%546Mitsubishi Fuso2,0143.4%+ 2.7%88,3922.9%– 32.0%877Isuzu1,9493.3%+ 20.8%78,7623.0%– 11.7%688Wuling1,4022.4%– 30.8%67,3492.5%– 0.6%9109Hyundai1,2232.1%– 51.2%98,5202.9%– 29.9%7610Hino9151.6%+ 11.9%106,7642.3%– 24.8%10911Chery7151.2%+ 84.8%112,0660.7%+ 140.5%111412MG3450.6%+ 516.1%151,0380.4%+ 173.2%142013Mazda3370.6%– 5.9%121,4320.5%– 1.6%121214Mercedes3030.5%+ 6.7%131,2650.4%– 23.8%131115Lexus2370.4%+ 7.2%149310.3%+ 96.0%161516BMW 2220.4%– 26.7%169970.3%– 0.1%151317UD Trucks1430.2%+ 52.1%194950.2%– 11.8%181618Dongfeng (DFSK)1000.2%– 2.0%204580.2%– 15.7%201819Nissan800.1%– 57.4%174960.2%– 30.5%171720Kia 800.1%– 47.7%184900.2%– 23.8%191921Mini590.1%+ 96.7%212630.1%+ 25.2%212122Subaru320.1%+ 10.3%221700.1%+ 17.2%222423Scania270.0%– 62.0%231140.0%– 59.7%232224FAW230.0%+ 27.8%25970.0%+ 56.5%242325Citroen150.0%n/a24870.0%n/a25 –26Neta100.0%new26840.0%new262827Volkswagen70.0%– 22.2%27430.0%– 54.7%272628Seres60.0%new29330.0%new283029Peugeot40.0%– 78.9%30270.0%– 70.0%302730Audi10.0%– 83.3%3190.0%– 35.7%3129
Indonesia April 2024 – models (wholesales):
PosModelApr-24%/23Mar2024%/23PosFY231Daihatsu Sigra3,7407.7%+ 41.7%120,6167.8%+ 5.9%132Toyota Rush3,0696.3%+ 43.9%1111,4534.3%– 23.8%893Toyota Kijang Innova2,8055.8%– 23.0%316,4786.2%+ 13.6%314Toyota Avanza2,6055.4%– 30.1%514,5035.5%– 30.0%425Suzuki Carry Pikap2,1794.5%– 27.1%810,2253.9%– 33.8%976Honda Brio2,0334.2%+ 201.2%217,0926.5%– 15.4%247Toyota Calya2,0214.2%– 35.5%612,0794.6%– 19.0%658Daihatsu Gran Max Pikap1,6183.3%– 33.2%412,3964.7%– 25.9%569Mitsubishi Xpander1,3122.7%– 65.0%711,5034.4%– 30.1%7810Daihatsu Ayla1,2482.6%– 29.5%125,8202.2%– 34.2%121211Daihatsu Terios1,2302.5%+ 7.3%107,2932.8%– 2.1%101112Toyota Hilux1,0802.2%– 35.9%203,4821.3%– 64.4%221613Toyota Agya9301.9%– 56.8%185,8602.2%– 15.7%111314Hyundai Stargazer8531.8%+ 24.7%254,6981.8%– 17.7%141915Mitsubishi Pajero Sport8301.7%– 36.0%154,6731.8%– 16.4%152416Honda BR-V8111.7%+ 20.9%134,0731.5%– 50.7%181717Daihatsu Xenia7821.6%– 30.6%174,5801.7%– 16.4%162218Mitsubishi L-300 Pikap7571.6%– 22.8%243,4201.3%– 32.3%232319Suzuki XL77571.6%+ 1029.9%213,8471.5%– 2.4%202020Mitsubishi L200 Triton6811.4%+ 530.6%292,1640.8%+ 80.9%302821Honda WR-V6771.4%– 61.6%233,3371.3%– 50.0%241522Isuzu Traga PHR6661.4%– 4.7%223,1101.2%– 23.6%262623Toyota Raize6231.3%+ 4.9%193,1121.2%– 48.2%251824Wuling Cloud5971.2%new –5970.2%new48 –25Honda HR-V5331.1%– 47.5%95,6932.2%– 54.4%131026Toyota Alphard4871.0%+ 148.5%581,2340.5%+ 1.7%363927Daihatsu Gran Max Minibus4771.0%– 41.0%282,9331.1%– 9.8%272528Suzuki Ertiga4590.9%– 50.1%272,6981.0%– 35.4%282729Mitsubishi Xforce4250.9%new661,3250.5%new334730Chery OMODA E54100.8%new311,2910.5%new35 –31Wuling Binguo3920.8%new263,5131.3%new215632Suzuki Alpha3870.8%new341,1380.4%new37 –33Honda CR-V3590.7%– 17.3%321,8580.7%– 13.7%313634Hyundai Creta3330.7%– 34.6%352,6221.0%– 30.6%292935Toyota Veloz3320.7%– 80.5%164,3031.6%– 48.0%171436Toyota Yaris Cross3260.7%new301,4380.5%new323037Suzuki Baleno2890.6%+ 389.8%338470.3%+ 30.9%414438Toyota Fortuner2750.6%– 81.1%143,9291.5%– 35.4%192139Suzuki S-Presso2730.6%– 2.5%391,2920.5%+ 19.0%343840Suzuki APV Minibus2710.6%+ 73.7%439490.4%+ 20.3%404041Daihatsu Rocky2680.6%– 45.0%361,0860.4%– 49.7%393542Toyota Hiace2340.5%– 64.7%551,1260.4%– 0.7%383743MG 42090.4%new445700.2%new5013944Suzuki Jimny1850.4%+ 285.4%378340.3%+ 163.1%426445Hyundai Palisade1790.4%– 26.9%386900.3%– 31.0%464546Toyota Voxy1590.3%+ 33.6%507490.3%+ 75.4%434647Isuzu D-Max1320.3%– 17.5% –1320.1%– 80.4%775348Toyota Land Cruiser 3001310.3%+ 424.0%725670.2%+ 1188.6%516149Mazda CX-51250.3%– 60.2%545140.2%+ 27.2%535150Lexus LM1220.3%+ 408.3%484960.2%+ 892.0%547451Honda Mobilio1200.2%+ 0.0%563610.1%– 45.5%585452Mazda CX-31120.2%+ 12.0%513500.1%– 64.8%605053Suzuki Grand Vitara1110.2%new496640.3%new475254Lexus RX1000.2%– 59.3%523550.1%– 2.7%596055Daihatsu Luxio980.2%– 66.1%476950.3%– 48.2%454256Chery OMODA 5960.2%– 76.5%535910.2%+ 1.4%494357Suzuki Ignis750.2%– 43.2%672950.1%– 40.6%635758Wuling Alvez690.1%– 83.5%405450.2%– 68.5%523259Mazda3690.1%+ 91.7%612660.1%+ 466.0%667060MG ZS580.1%+ 262.5%792460.1%+ 79.6%688761Hyundai Santa Fe570.1%– 24.0%642150.1%– 41.3%696262Honda Civic540.1%– 12.9%573330.1%– 10.0%615863Toyota Vellfire530.1%+ 960.0%1021280.0%+ 58.0%7910464MG VS HEV530.1%new –530.0%new100 –65Hyundai Ioniq 5510.1%– 92.9%634460.2%– 74.6%563166Wuling Confero S510.1%– 71.0%424100.2%– 72.0%573367Kia Sonet480.1%+ 33.3%682710.1%+ 70.4%656768Wuling Air460.1%– 89.8%457320.3%– 26.1%443469Mercedes GLC450.1%+ 4400.0%941060.0%+ 10500.0%868870BMW X1450.1%n/a991360.1%+ 13500.0%769371Chery Tiggo 5X400.1%new121480.0%new107 –72Dongfeng Mini Truck390.1%– 4.9%692900.1%– 34.2%646673Mercedes C-Class350.1%– 20.5%601860.1%– 32.4%706574Nissan Serena350.1%+ 288.9%741520.1%+ 14.3%758475Mazda CX-30330.1%– 5.7%85960.0%– 17.2%909676Mercedes GLE310.1%+ 93.8%711600.1%+ 119.2%749177BMW X5300.1%– 14.3%621830.1%+ 4.0%717178Mercedes GLA280.1%– 6.7%751120.0%– 34.1%8310579Kia Carens260.1%– 40.9%651120.0%– 10.4%849480BMW 3 Series260.1%– 36.6%701780.1%– 23.6%726881Mini Countryman250.1%– 3.8%811050.0%– 11.8%879982BMW X3220.0%– 48.8%821230.0%– 44.8%818283Mini Cooper220.0%+ 69.2%771000.0%+ 17.6%897584Mercedes A-Class210.0%+ 133.3%98630.0%+ 8.6%9710685Daihatsu Sirion200.0%– 77.8%90400.0%– 90.0%1137886Nissan Livina200.0%– 72.6%831100.0%– 68.6%857287Toyota Yaris200.0%– 45.9%761710.1%– 76.5%735588MG 5 GT200.0%– 25.9%801040.0%– 37.7%888189MG HS190.0%+ 18.8%87710.0%+ 0.0%9411290Lexus LX190.0%+ 72.7%109490.0%+ 122.7%10312691Chery Tiggo 8190.0%new –190.0%new132 –92BMW 2 Series180.0%+ 200.0%95760.0%+ 81.0%9310093BMW 7 Series170.0%+ 1600.0%107550.0%+ 1275.0%9912294BMW i7170.0%new88490.0%new10412595Toyota Vios150.0%– 55.9%100460.0%– 76.0%1087696Mazda CX-8150.0%– 28.6%142380.0%– 36.7%11710297Honda Accord140.0%– 72.5%861130.0%– 21.5%828598Toyota Corolla140.0%– 57.6%101400.0%– 81.0%1147799Wuling Formo140.0%– 54.8%462600.1%– 69.6%6748100Mazda CX-60140.0%new92490.0%new105131101Toyota Camry130.0%– 84.0%93610.0%– 82.3%9879102BMW IX130.0%– 75.9%113490.0%– 41.0%10669103Chery Tiggo 7 Pro120.0%– 72.1%127420.0%– 72.7%11286104Nissan Magnite120.0%– 58.6%78790.0%+ 33.9%9297105Mazda MX-5120.0%+ 200.0%150190.0%+ 137.5%133146106Mini Clubman110.0%+ 1000.0%97510.0%+ 466.7%102144107BMW IX1110.0%new133150.0%new137 –108Honda City100.0%– 93.8%593150.1%– 68.0%6241109BMW Z4100.0%– 75.6%106250.0%– 41.9%126140110Toyota GR 86100.0%+ 25.0%115290.0%+ 16.0%125132111Kia Carnival100.0%+ 400.0% –100.0%– 86.1%144124112Chery GT100.0%new84890.0%new91118113Kia EV9100.0%new89670.0%new96156114Nissan Kicks100.0%n/a91530.0%+ 32.5%101123115Hyundai Staria90.0%– 25.0%104390.0%– 36.1%115121116Citroen C3 Aircross SUV90.0%new –90.0%new147 –117Wuling Almaz80.0%– 83.3%414520.2%– 20.7%5549118Subaru Forester80.0%+ 14.3%119300.0%+ 76.5%124157119Toyota Corolla Cross60.0%– 90.0%126240.0%– 94.9%12859120Wuling Cortez60.0%– 87.5%1391310.0%– 64.3%7863121Subaru Crosstrek60.0%– 60.0%117320.0%+ 113.3%122117122VW Tiguan60.0%– 40.0%108330.0%– 66.7%120110123Subaru BRZ60.0%– 40.0%125320.0%– 64.8%121116124Lexus ES60.0%– 14.3% –70.0%– 86.3%152111125Citroen C360.0%new731270.0%new80 –126Mercedes Sprinter60.0%n/a132170.0%n/a135155127Nissan Terra50.0%– 87.5%103350.0%– 12.5%118130128Dongfeng Gelora50.0%– 77.3%105390.0%– 57.6%11695129BMW i450.0%– 66.7%118150.0%+ 0.0%138150130Mazda CX-950.0%– 61.5%112210.0%– 74.4%129119131Mazda250.0%– 28.6%128320.0%– 61.4%123109132Subaru WRX50.0%+ 25.0%114250.0%+ 0.0%127129133BMW X750.0%+ 400.0%96460.0%– 2.1%109133134Seres E50250.0%new116440.0%new110135135BMW 5 Series40.0%– 92.2%140150.0%– 91.2%13990136Chery Tiggo 8 Pro30.0%– 95.3%129430.0%– 80.8%11173137Peugeot 500830.0%– 66.7%135180.0%– 52.6%134147138Mercedes V-Class30.0%+ 0.0%131130.0%– 40.9%141151139Subaru Outback30.0%n/a120210.0%n/a130158140Mercedes E-Class20.0%– 95.8%111170.0%– 91.9%13680141Hyundai Ioniq 620.0%new149130.0%new142101142Mercedes EQS10.0%– 90.9%13080.0%– 66.7%149149143Peugeot 200810.0%– 83.3% –60.0%– 45.5%156164144Mazda610.0%– 80.0%134100.0%– 81.8%145128145Mercedes GLS10.0%– 75.0% –20.0%– 96.0%169134146Audi Q510.0%– 50.0% –20.0%+ 0.0%167185147VW T-Cross10.0%n/a14180.0%– 11.1%150154148Mitsubishi L100 EV10.0%new13860.0%new155 –149Mercedes EQE10.0%new14440.0%new158153150Mercedes GLC Coupe10.0%n/a –30.0%– 70.0%163169151Toyota bZ4X10.0%n/a –30.0%– 95.3%16483152Genesis G8010.0%n/a –20.0%n/a168171
Source: GAIKINDO
