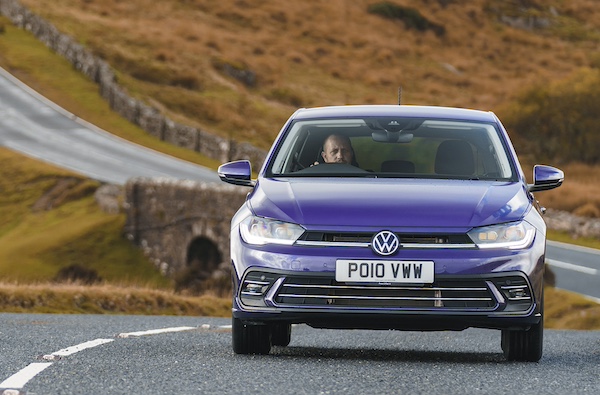
UK April 2024: VW Polo surges to #2, Audi A3 breaks ranking record
VW Polo sales are up 282.6% in April.
New car sales in the UK mark 21 consecutive months of year-on-year gains in April, but just: volumes are up 1% year-on-year to 134,274 units. This remains -16.6% below the pre-pandemic sales of April 2019. The year-to-date tally is up 8.4% to 679,822. Once again and somewhat worryingly, the market growth is only due to soaring fleet sales up 18.5% to 81,207 and 60.5% share vs. 51.5% a year ago whereas private sales sink -17.7% to 50,458 and 37.6% vs. 46.1% in April 2023. Meanwhile business sales skid -16.1% to 2,609 and 1.9% share vs. 2.3%. The year-to-date trend is similar with fleet sales up 26.7% to 407,661 and 60% share vs. 51.3% over the same period in 2023, private sales down -11% to 257,804 and 37.9% share vs. 46.2% and business sales off -9.4% to 14,357 and 2.1% share vs. 2.5%.
Looking at sales by propulsion, petrol is down -3.1% to 74,877 an 55.8% share vs. 58.1% a year ago, BEVs gain 10.7% to 22,717 and 16.9% vs. 15.4% in April 2023, HEVs are up 16.7% to 17,538 and 13.1% share vs. 11.3% last year, PHEVs soar 22.1% to 10,493 and 7.8% vs. 6.5% ad diesel sinks -25.3% to 8,649 and 6.4% share vs. 8.7%. Year-to-date, petrol is up 6.7% to 381,802 and 56.2% share vs. 57.1% over the same period in 2023, BEVs are up 10.6% to 107,031 and 15.7% share vs. 15.4%, HEVs up 13.3% to 91,633 and 13.5% share vs. 12.9%, PHEVs up 31.4% to 53,052 and 7.8% share vs. 6.4% and diesel off -9.8% to 46,304 and 6.8% share vs. 8.2%.
In the lead of the brands ranking, Volkswagen (+12.8%) leaps up to 9.9% share vs. 8% so far this year. Audi (-9.9%) follows but drops on a particularly solid year-ago result. In contrast BMW (+34.6%) surges ahead but holds 6.8% share, the same level as YTD where it ranks #2. Ford (-20.8%) is in freefall at #4 and is down to #5 year-to-date vs. #2 over the Full Year 2023. Mercedes (+28.4%), Nissan (+18.2%) and Skoda (+13.5%) also shine year-on-year as does Toyota (+7.5%) to a lesser extent. Kia (+1.4%) and Hyundai (+0.8%) are more muted. Below, notice Jaguar (+92.1%), Seat (+83.9%), Renault (+76.6%), Lexus (+48.8%) and Volvo (+29.6%) excelling among brands holding 1% share or more. Further down, BYD (+1048.3%), Ora (+700%), Smart (+675%) and Subaru (+75.3%) stand out.
Over in the models ranking, the Ford Puma (+21.5%) reclaims the top spot it holds year-to-date with 3.2% share vs. 2.9% so far this year. The VW Polo (+282.6%) surges to #2, its first Top 10 finish of the year and best ranking since August 2022 when it was #1. As a reminder the Polo ranked #16 over the Full Year 2023. The Audi A3 (+18.1%) continues to impress at #3, this is the nameplate’s first ever podium incursion in the UK, eclipsing a previous record of #5 reached 6 times over the past 10 years: in April 2014, October 2016, April 2023, May 2023, February 2024 and March 2024. The MG HS (+120.8%) and Volvo XC40 (+22.6%) also post fantastic gains in the remainder of the Top 10.
Previous month: UK March 2024: Nissan Qashqai #1, Audi A3 and Mercedes A-Class impress
One year ago: UK April 2023: Audi teases VW for #1 spot, Ford Puma manages 2nd ever win
Full April 2024 Top 47 All brands and Top 10 models below.
UK April 2024 – brands:
PosBrandApr-24%/23Mar2024%/23PosFY231Volkswagen13,2609.9%+ 12.8%154,5918.0%+ 3.5%112Audi 10,2537.6%– 9.9%642,7156.3%– 3.1%333BMW 9,1566.8%+ 34.6%345,9276.8%+ 40.7%244Ford 8,1526.1%– 20.8%740,7196.0%– 12.8%525Kia8,0446.0%+ 1.4%541,1286.0%+ 2.3%466Toyota7,0225.2%+ 7.5%833,2154.9%– 13.2%857Hyundai6,6194.9%+ 0.8%1030,0994.4%– 1.8%10108Mercedes 6,5724.9%+ 28.4%435,1155.2%+ 21.9%799Skoda5,9864.5%+ 13.5%1424,4373.6%+ 9.7%131210Nissan 5,8004.3%+ 18.2%239,2035.8%+ 27.0%6811MG5,3714.0%+ 6.7%1128,5094.2%+ 10.9%111112Volvo4,8093.6%+ 29.6%1718,4322.7%+ 18.0%161513Vauxhall 4,3863.3%– 44.1%933,0504.9%+ 7.7%9714Land Rover4,2983.2%+ 6.7%1222,8703.4%+ 15.3%141415Peugeot 4,2903.2%– 22.4%1325,5963.8%+ 24.7%121316Renault4,1233.1%+ 76.6%1518,7872.8%+ 75.0%151817Seat3,4332.6%+ 83.9%2014,5832.1%+ 25.2%181918Dacia2,3331.7%– 20.5%2210,6581.6%+ 1.4%222219Mini2,3071.7%– 35.2%1914,9012.2%– 4.5%171720Citroen2,1081.6%– 5.7%2311,4821.7%– 2.6%212021Cupra1,9841.5%+ 2.7%268,9671.3%+ 24.6%252422Suzuki1,5781.2%+ 13.3%219,2541.4%+ 11.6%232323Mazda1,5371.1%– 31.3%259,0041.3%– 17.7%242124Honda1,5301.1%– 34.0%1613,7122.0%+ 29.4%192525Porsche1,4161.1%– 24.5%286,2640.9%– 21.0%282626Tesla1,3521.0%– 25.4%1813,1201.9%– 13.5%201627Jaguar1,3291.0%+ 92.1%248,0881.2%+ 103.7%262928Lexus1,3181.0%+ 48.8%295,1810.8%+ 50.4%292829Fiat1,1750.9%– 9.4%276,4340.9%– 11.1%272730Polestar4700.4%– 60.3%311,7680.3%– 62.4%313031Jeep3460.3%+ 200.9%302,8350.4%+ 149.3%303132BYD3330.2%+ 1048.3%321,6110.2%+ 2457.1%323833Smart2480.2%+ 675.0%367790.1%+ 589.4%344334Subaru1420.1%+ 75.3%331,0410.2%+ 57.3%333235KGM/SsangYong1390.1%– 6.7%347420.1%+ 30.9%353436Alfa Romeo1190.1%– 7.8%374480.1%– 7.8%373537Genesis980.1%– 1.0%413160.0%– 31.3%403638Bentley960.1%– 31.9%403410.1%– 38.4%393739Ora880.1%+ 700.0%355100.1%+ 126.7%363940DS690.1%– 73.2%384390.1%– 58.3%383341Maserati430.0%– 35.8%421990.0%– 48.2%434042Alpine280.0%+ 40.0%431780.0%+ 66.4%444443Abarth270.0%– 52.6%393090.0%+ 113.1%414144Ineos260.0%– 72.3%44960.0%+ 2.1%454245Fisker70.0%new452140.0%new424546Maxus10.0%+ 0.0%4620.0%– 50.0%464747Chevrolet00.0%n/a4710.0%n/a4746 –Other British2100.2%– 32.7% –1,0720.2%– 11.7% – – –Other Imports2430.2%+ 85.5% –8800.1%+ 58.6% – –
UK April 2024 – models:
PosModelApr-24%/23Mar2024%/23PosFY231Ford Puma4,3393.2%+ 21.5%219,3932.9%+ 47.7%112VW Polo3,4132.5%+ 282.6%n/an/an/an/an/a163Audi A33,0102.2%+ 18.1%513,5032.0%+ 52.4%494Nissan Qashqai2,4951.9%– 1.7%117,0502.5%+ 25.3%225VW Golf2,3611.8%+ 4.5%812,6511.9%+ 38.9%6126Kia Sportage2,1921.6%– 28.7%315,8242.3%+ 25.3%347VW T-Roc2,1621.6%– 9.4%n/a11,0961.6%+ 5.6%9208MG HS2,0731.5%+ 120.8%1012,1011.8%+ 50.9%8139Volvo XC402,0691.5%+ 22.6%n/an/an/an/an/a1410VW Tiguan2,0041.5%+ 5.6%n/an/an/an/an/a17n/aNissan Juke1,8641.4%+ 8.7%413,0701.9%+ 3.8%48n/aBMW 1 Series1,8041.3%+ 19.9%n/a12,2101.8%+ 109.2%722n/aMini1,0180.8%– 55.8%n/a11,0671.6%+ 4.1%107
Source: SMMT


