Italy April 2024: Sales back in positive at +7.5%, BEVs off -19.6%, Citroen C3, Toyota Yaris shine
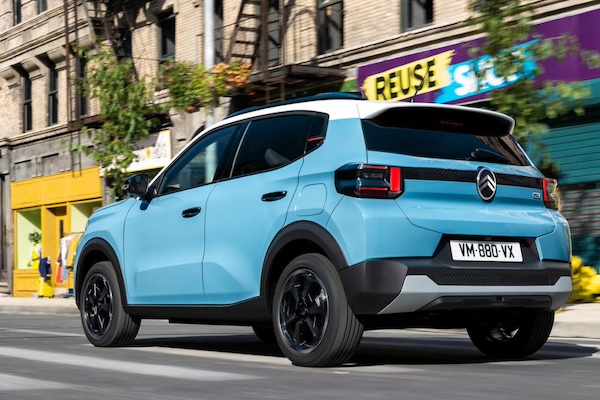
Citroen C3 sales are up 348% year-on-year in April.
New car sales in Italy are back into positive territory in April at +7.5% year-on-year to 135,353 units. The year-to-date tally is up 6.1% to 586,665 but down -17.7% over the same period in pre-pandemic 2019. Private sales outrun the market at +13.9% to 69,700 and 50.9% share vs. 48.1% in April 2023 and are up 8.4% YTD to 324,532 and 54.6% share vs. 53.4% over the first four months of 2023. Self registrations are up 39% to 16,249 for the month and up 20.8% YTD to 60,300, long term leases disappoint at -15.8% to 28,679 in April and off -15% YTD to 123,981. Short term rentals edge past the market at +9% to 14,893 and shoot up 58.2% YTD to 53,025 and 8.9% share vs. 6% a year ago. Finally company sales gain 10.1% to 7,399 in April and 3.2% YTD to 32,508.
As for sales by propulsion, petrol is up 16.2% in April to 43,229 and 31.6% share vs. 29.2% a year ago and up 19.7% YTD to 184,856 and 31.1% vs. 27.6% in 2023. Diesel drops -21.8% to 19,709 and -18.7% YTD to 89,380. LPG is up 10.3% to 11,635 and up 7.5% YTD to 53,928. HEV sales progress by 23% year-on-year this month to 54,438 and 39.7% share vs. 34.7% a year ago. This includes 14,673 full hybrids (+39.2%) and 39,765 mild hybrids (+17.9%). YTD, HEVs are up 15.3% to 229,536 and 38.6% share vs. 35.5% including 62,798 full hybrids (+20.6%) and 166,738 mild hybrids (+13.5%). Next we witness the particularly poor results of rechargeable vehicles. PHEVs freefall -26.1% to 4,482 for the month and -24.6% YTD to 18,987 while BEVs sink -19.6% to 3,208 and 2.3% share vs. 3.1% a year ago and are off -18.8% YTD to 16,609 and 2.8% share vs. 3.7% in 2023.
The top 2 manufacturers miss out on the positive market with negative year-on-year results. Flat is down -1% to 11.2% share, identical to its YTD level while Volkswagen (-11.7%) is in a rut, but at 7.6% of the market it is above its YTD share of 7.3%. Toyota (+65.6%) shoots up year-on-year and manages to stay #2 year-to-date above Volkswagen. Dacia (+21.1%) remains at a splendid 4th place while Renault (+15.1%) climbs one spot on March to #5. Citroen (+96.3%) manages the largest year-on-year gain in the Top 10 at #9 with BMW (+22.5%) also in excellent shape at #7. Below, Honda (+124.4%), Land Rover (+86.9%), Nissan (+69.4%), Seat (+62.3%), Cupra (+61.3%) and Porsche (+45%) shine in the remainder of the Top 30 while further down Mitsubishi (+1181.4%) benefits from the launch of the badge-engineered ASX and Colt. Tesla is down -53.4%.
Model-wise, strikingly the entire Top 9 bar the Lancia Ypsilon (+1.9%) outruns the market with double-digit gains. The Fiat Panda (+39.6%) sells double the #2, the Dacia Sandero (+46.8%) while the Citroen C3 (+348%) posts a surreal lift and ensures the Top 4 is unchanged on March. The Toyota Yaris (+136%) is equally impressive at #5. The Renault Clio (+56.2%) is up three spots on March to #7, passing its archenemy the Peugeot 208 (+25.6%). The MG ZS (+50.3%) breaks into the Top 10 for the 2nd time at #9 (previous was #7 last December). The Ford Puma (+12%) is also solid at #6. Below, the Toyota Aygo X (+256.6%), DR 5.0 (+91.2%), Mercedes GLA (+83.3%), Hyundai i20 (+76.3%) and Nissan Qashqai (+76.3%) stand out.
Previous month: Italy March 2024: Market down -3.7%, BEVs off -34.5%
One year ago: Italy April 2023: Alfa Romeo Tonale, MG ZS and Jeep Avenger highlight market up 29.2%
Full April 2024 Top 50 brands and models below.
Italy April 2024 – brands:
PosBrandApr-24%/23Mar2024%/23PosFY231Fiat15,20711.2%– 1.0%165,72011.2%– 0.4%112Volkswagen10,2817.6%– 11.7%242,8797.3%– 6.3%323Toyota9,9727.4%+ 65.6%343,9307.5%+ 30.2%234Dacia7,7985.8%+ 21.1%435,6136.1%+ 14.9%445Renault7,0965.2%+ 15.1%628,0394.8%+ 2.9%666Ford6,6104.9%– 10.4%726,7184.6%– 14.0%757BMW6,1994.6%+ 22.5%1024,9684.3%+ 24.5%10108Peugeot5,9574.4%– 21.8%530,3075.2%+ 1.4%579Citroen5,9454.4%+ 96.3%925,7954.4%+ 31.8%91110Audi5,7624.3%– 10.2%1124,9344.3%+ 6.3%11911Jeep5,0253.7%– 16.6%825,8644.4%– 3.6%8812Mercedes4,3013.2%+ 13.3%1216,7582.9%– 4.1%141213Hyundai4,2693.2%+ 14.5%1618,0213.1%+ 10.6%121314Kia3,8602.9%+ 0.1%1716,0482.7%– 1.9%161415Lancia3,7922.8%+ 1.9%1416,7152.8%+ 12.8%151516MG3,6462.7%+ 20.4%1813,5732.3%+ 73.4%192017Opel3,6172.7%– 11.1%1517,2672.9%– 5.0%131618Suzuki3,3462.5%+ 23.3%2014,2722.4%+ 28.7%181819Skoda3,2042.4%+ 11.2%1912,9452.2%+ 14.3%201920Nissan2,5091.9%+ 69.4%1315,4192.6%+ 22.7%171721Alfa Romeo2,2911.7%– 3.7%218,8161.5%– 1.1%212122DR Motor1,8721.4%– 12.0%325,9361.0%– 34.5%242223Cupra1,6681.2%+ 61.3%236,1581.0%+ 27.7%232424Seat1,4231.1%+ 62.3%285,3240.9%+ 23.0%252825Volvo1,3461.0%+ 10.9%227,1601.2%+ 28.0%222526Mini1,2150.9%– 9.7%264,9380.8%– 27.3%272327Land Rover9570.7%+ 86.9%293,5170.6%+ 16.7%292928Mazda8890.7%+ 19.8%255,1930.9%– 10.7%262729Porsche8310.6%+ 45.0%273,4390.6%+ 28.8%303030Honda6980.5%+ 124.4%302,7790.5%+ 46.2%313331DS5800.4%– 7.9%312,2620.4%– 15.6%323232Mitsubishi5510.4%+ 1181.4%351,3100.2%+ 129.0%354033EVO4580.3%+ 52.7%332,0390.3%+ 38.1%333134Lexus3990.3%+ 34.8%341,6470.3%+ 66.0%343635Tesla3450.3%– 53.4%244,0650.7%– 23.2%282636Smart3000.2%– 17.8%361,1810.2%– 30.4%363437Maserati2010.1%– 38.0%371,0030.2%– 27.1%373538EMC1400.1%+ 164.1%414520.1%+ 63.8%41n/a39Sportequipe1120.1%+ 1144.4%456170.1%+ 4646.2%38n/a40Jaguar840.1%– 33.9%394770.1%+ 1.3%403941Subaru830.1%– 61.2%384860.1%– 49.8%393842Lynk & Co810.1%– 89.8%403600.1%– 83.9%423743Ferrari640.0%– 12.3%422890.0%+ 4.3%434344BYD570.0%new432150.0%new44n/a45Lotus380.0%+ 171.4%471200.0%+ 215.8%474646Lamborghini370.0%– 9.8%441680.0%+ 15.9%454447SsangYong360.0%+ 157.1%461660.0%+ 33.9%464548Mahindra230.0%– 73.9%481060.0%– 48.5%484249Polestar110.0%– 88.5%49480.0%– 86.0%494150Aston Martin90.0%+ 50.0%50390.0%+ 18.2%5047 –Others1580.1%+ 315.8% –5700.1%+ 175.4% – –
Italy April 2024 -models:
PosModelApr-24%/23Mar2024%/23PosFY231Fiat Panda10,3147.6%+ 39.6%144,6377.6%+ 24.0%112Dacia Sandero5,1793.8%+ 46.8%223,0653.9%+ 41.5%223Lancia Ypsilon3,7922.8%+ 1.9%316,7152.8%+ 12.8%434Citroen C33,7322.8%+ 348.0%417,4623.0%+ 74.1%385Toyota Yaris3,5712.6%+ 136.0%611,9562.0%+ 49.2%8166Ford Puma2,9602.2%+ 12.0%1111,2521.9%+ 16.3%997Renault Clio2,9392.2%+ 56.2%1011,1301.9%+ 30.2%10138Peugeot 2082,8502.1%+ 25.6%911,9872.0%+ 63.3%7149MG ZS2,6562.0%+ 50.3%1410,1241.7%+ 168.0%142210VW T-Roc2,6201.9%+ 5.6%711,0281.9%– 7.6%11611Jeep Avenger2,5861.9%+ 47.6%813,1842.2%#VALUE!51812Renault Captur2,3461.7%+ 5.6%1210,6791.8%– 0.8%12713VW T-Cross2,2791.7%+ 12.0%138,3831.4%+ 0.3%182014Dacia Duster2,2681.7%– 0.4%1710,6681.8%– 10.5%131015Toyota Yaris Cross2,2601.7%+ 2.0%512,8762.2%– 3.3%6416Fiat 5002,1931.6%– 46.9%218,8051.5%– 41.6%17517Fiat 500X2,0241.5%– 27.7%238,9451.5%– 17.6%161218Opel Corsa1,9881.5%+ 24.2%228,0931.4%– 16.8%201719Kia Sportage1,7841.3%+ 26.0%187,9011.3%+ 24.5%212320Toyota Aygo X1,7401.3%+ 256.6%207,3681.3%+ 93.4%223021VW Tiguan1,5411.1%– 5.6%364,7840.8%– 29.6%372822Alfa Romeo Tonale1,5201.1%– 16.9%286,2361.1%– 1.8%252523BMW X11,5041.1%+ 47.0%256,5771.1%+ 62.3%243224Audi Q31,4181.0%– 13.4%355,3110.9%– 8.9%293125Citroen C3 Aircross1,4141.0%+ 32.0%335,3820.9%– 5.7%283526Hyundai i201,4091.0%+ 76.3%n/a4,2490.7%+ 70.2%42n/a27Nissan Qashqai1,3101.0%+ 76.3%158,2171.4%+ 18.1%192128Jeep Compass1,2931.0%– 37.4%306,1991.1%– 37.1%261929Peugeot 20081,2760.9%+ 47.7%169,7481.7%+ 49.1%151530Jeep Renegade1,2460.9%– 46.3%196,9131.2%– 53.4%231131Audi A31,2230.9%+ 31.6%385,1640.9%+ 48.1%324132Ford Focus1,2080.9%+ 5.1%264,8820.8%– 30.6%352933Suzuki Vitara1,2000.9%n/a444,4130.8%n/a415034Mercedes GLA1,1710.9%+ 83.3%274,8680.8%+ 18.6%363735DR 5.01,1110.8%+ 91.2%n/an/an/an/an/an/a36VW Taigo1,0740.8%+ 7.4%314,7190.8%+ 13.0%384937Skoda Kamiq1,0560.8%n/a433,2970.6%n/a49n/a38Cupra Formentor1,0530.8%+ 26.9%503,7590.6%– 4.5%463639Toyota C-HR1,0410.8%+ 59.2%345,1270.9%+ 32.2%33n/a40VW Polo1,0250.8%– 44.2%325,5260.9%– 7.9%272641VW Golf1,0000.7%– 31.6%294,4290.8%+ 8.3%404542Ford Kuga9840.7%– 48.1%395,2090.9%– 29.7%312743BMW Serie 19370.7%+ 9.3%n/a3,2940.6%– 9.3%50n/a44Nissan Juke9170.7%n/a245,2640.9%n/a304045Hyundai Tucson9020.7%– 1.6%373,9000.7%– 33.6%443446BMW Serie 38740.6%+ 106.1%n/a3,2160.5%+ 81.3%n/an/a47Ford Tourneo Courier8630.6%n/an/a2,3390.4%n/an/an/a48Hyundai i108390.6%– 33.1%415,0590.9%+ 7.9%343349Kia Picanto8240.6%– 13.2%n/a3,3600.6%– 16.9%483950Renault Austral8120.6%– 0.7%n/an/an/an/an/a46n/aPeugeot 30087560.6%– 71.3%403,9200.7%– 57.9%4324n/aSuzuki Ignis7030.5%– 40.1%n/a3,8650.7%+ 30.4%4543n/aAudi Q26400.5%n/an/a3,5710.6%n/a47n/an/aOpel Mokka5760.4%– 62.5%494,4970.8%– 3.5%3942
Source: UNRAE
