
Cyprus September 2026: Jeep Avenger and BYD Seal U reach ranking records

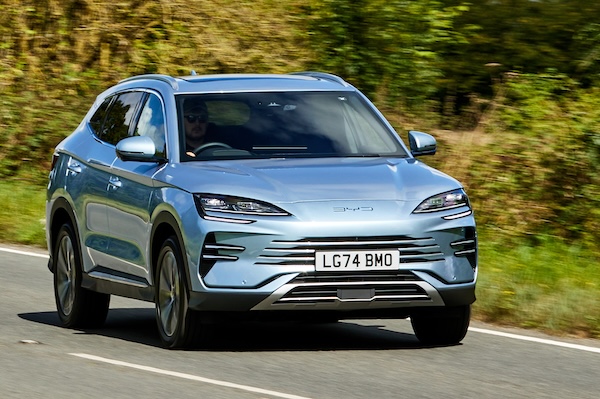
The BYD Seal U reaches a record third place in Cyprus in September.
According to data by our local partners SEMO Cyprus and INNOSOFT, the Cyprus new car market sinks -16.6% year-on-year in September to 1,194 registrations. This means the year-to-date tally is now down -10.9% to 10,518. Kia (-30.2%) reclaims the brands top spot it holds year-to-date off Toyota (-39.8%) but falls to 12.4% share vs. 15.6% so far this year. The event of the month is the record 2nd place of Chinese carmaker BYD, up 47.9% year-on-year. Its 105 sales and 8.8% share are not records however (best is 111 sales and 9.8% last June). Nissan (-36.5%) also plummets at #4 while Jeep (+16.9%) shines at #5 with 5.8% share. MG (+42.4%) and Audi (+19.6%) are also up in the remainder of the Top 10.
Model-wise, the Kia Stonic (-13.6%) returns to its traditional first place with 6.4% share. It is followed this month by the Jeep Avenger (+8.7%) reaching an all time high 2nd place with 4.2% share. The BYD Seal U (+109.5%) is up 15 spots on August to break into the Cyprus podium for the first time at #3, distancing the Nissan Qashqai (-30.4%) and Hyundai Tucson (stable). The Renault Captur (+160%), MG ZS (#11), Nissan X-Trail (+46.2%) and Skoda Kamiq (+112.5%) also make themselves noticed below. The Top 13 models are all SUVs.
Previous month: Cyprus August 2026: Toyota up 47.3% to 15.3% share
One year ago: Cyprus September 2025: BYD up to #7 with 5% share
Full September 2026 Top 35 All brands and Top 20 models below.
Cyprus September 2026 – brands:
PosBrandSep-26%/25Aug2026%/25PosFY251Kia14812.4%– 30.2%21,64315.6%– 13.5%112BYD1058.8%+ 47.9%77076.7%+ 636.5%4183Toyota978.1%– 39.8%19659.2%– 12.7%224Nissan806.7%– 36.5%57927.5%– 20.9%355Jeep695.8%+ 16.9%103883.7%– 15.7%1096Hyundai635.3%– 32.3%36095.8%– 41.7%737Audi615.1%+ 19.6%83193.0%– 23.1%11108Volkswagen615.1%– 40.8%46436.1%– 38.2%549MG473.9%+ 42.4%241821.7%+ 59.6%172110BMW463.9%– 28.1%66135.8%– 3.2%6611Mercedes433.6%– 4.4%94734.5%– 15.2%8712Renault423.5%– 54.3%134043.8%– 25.0%9813Skoda383.2%+ 58.3%113183.0%+ 10.4%121314Dacia312.6%– 29.5%222972.8%– 24.0%131115Porsche282.3%+ 7.7%181781.7%– 19.1%181616Peugeot262.2%+ 4.0%122192.1%+ 32.7%161917Seat252.1%+ 525.0%201041.0%+ 22.4%242418Ford242.0%+ 14.3%162362.2%– 36.7%151219Cupra221.8%+ 100.0%191251.2%+ 31.6%222220Land Rover221.8%– 33.3%172602.5%+ 9.2%141521Lexus221.8%– 8.3%141631.5%– 6.3%192022Citroen201.7%+ 900.0%211091.0%+ 109.6%232823BAIC121.0%new26750.7%new27 –24Mazda100.8%+ 42.9%29560.5%– 12.5%302625Opel90.8%+ 350.0%23580.6%+ 123.1%292926Suzuki90.8%+ 50.0%28690.7%+ 43.8%282727Volvo80.7%– 75.0%151611.5%– 20.3%201728Ssangyong70.6%– 22.2%27810.8%+ 35.0%262529Mini60.5%– 76.0%301271.2%– 48.8%211430Honda50.4%– 61.5%25810.8%– 14.7%252331Alfa Romeo30.3%+ 50.0% –180.2%+ 38.5%313132Changan20.2%new –20.0%new37 –33Bentley10.1%– 75.0%32110.1%– 35.3%333034Ferrari10.1%n/a –40.0%– 50.0%363335Maserati10.1%– 83.3%31180.2%+ 12.5%3232
Cyprus September 2026 – models:
Please note this ranking features the Top 30 models year-to-date ordered based on their September volume and may therefore not be 100% accurate.
PosModelSep-26%/25Aug2026%/25PosFY251Kia Stonic766.4%– 13.6%36155.2%– 5.2%112Jeep Avenger504.2%+ 8.7%102882.4%– 0.3%573BYD Seal U443.7%+ 109.5%182141.8%+ 791.7%10n/a4Nissan Qashqai393.3%– 30.4%133743.2%– 12.4%345Hyundai Tucson363.0%+ 0.0%13352.8%– 25.9%436Kia Sportage342.8%– 34.6%64183.5%– 24.0%227Toyota Yaris Cross282.3%– 20.0%22792.4%+ 9.0%6108Toyota C-HR272.3%– 57.1%142662.3%– 11.6%789Renault Captur262.2%+ 160.0%71911.6%+ 141.8%11n/a10Dacia Duster201.7%+ 0.0%191391.2%– 15.8%161811MG ZS (est)201.7%n/an/a1020.9%+ 104.0%26n/a12Hyundai Kona191.6%+ 5.6%151321.1%– 54.5%191113Nissan X-Trail191.6%+ 46.2%171181.0%– 7.8%222014Kia Picanto171.4%– 22.7%n/a1411.2%– 31.2%151715Nissan Juke171.4%– 56.4%122632.2%– 25.3%8616Skoda Kamiq171.4%+ 112.5%81211.0%+ 39.1%21n/a17Mercedes GLC131.1%– 13.3%n/a980.8%+ 2.1%292918Peugeot 3008131.1%+ 8.3%51231.0%+ 46.4%20n/a19BYD Atto 3121.0%– 50.0% –1521.3%+ 406.7%14n/a20VW Tiguan121.0%+ 9.1%n/a1000.8%– 16.7%2922n/aFord Puma110.9%+ 83.3%201141.0%+ 0.9%2426n/aBMW X1100.8%– 41.2%111361.2%– 32.7%1713n/aKia Xceed100.8%– 33.3%n/a2392.0%+ 19.5%914n/aVW T-Roc100.8%– 77.3%n/a1671.4%– 58.9%135n/aVW Taigo90.8%+ 80.0%n/a1020.9%– 32.0%2721n/aBYD Dolphin Surf60.5%– 60.0% –1161.0%+ 364.0%23n/an/aVW T-Cross60.5%– 77.8%n/a1331.1%– 36.7%1812n/aToyota Yaris50.4%– 68.8%4980.8%– 18.3%3025n/aVolvo XC4050.4%– 73.7%91050.9%– 1.9%2524 –Kia EV300.0%– 100.0%n/a1731.5%+ 0.0%1219
Source: SEMO Cyprus and INNOSOFT

More Stories
Panama September 2026: Hyundai Grand i10 leads again, Mitsubishi L200 in Top 5
The Mitsubishi L200 is back inside the Panama Top 5 in September. New light vehicle sales in Panama are stable...
Vietnam September 2026: Market up 28%, VinFast VF 3 now #1 year-to-date
According to data provided by VAMA, Hyundai and VinFast, the Vietnamese new vehicle market shoots up 28% year-on-year in September...
Thailand September 2026: Sales up 24.7%, MG (+72.3%) places Urban inside Top 10
The MG Urban ranks #10 in Thailand in September. It’s another very satisfying month for the Thai new light vehicle...
2026 Toyota Corolla Cross Invoice Price, Dealer Cost, and What You Should Pay Near You
The 2026 Toyota Corolla Cross sits at one of the most competitive price points in the compact crossover segment, starting...
2027 Volvo EX60 Faces Major Production Delays as U.S. Deliveries Slip Into Late 2027
Volvo’s highly anticipated EX60 electric SUV is running into some unexpected trouble, and American buyers hoping to get behind the...
2026 Ineos Grenadier Invoice Price, Dealer Cost, and What You Should Pay Near You
The 2026 Ineos Grenadier is one of the most purposeful vehicles on the market: a purpose-built body-on-frame 4×4 designed without...