
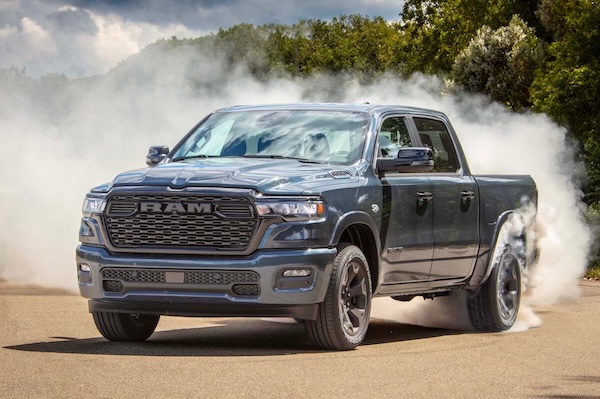
USA Q3 2026: Ram (+29.3%) surges, Jeep (-19.9%) falls, Detroit 3 at lowest ever 36% share

Ram Pickup sales are up 33.7% in a declining market.
New light vehicle sales in the US edge down -0.8% year-on-year over Q3 to 4,091,759, thanks to a strong September (+5.5% year-on-year according to GlobalData). This is a solid performance given high fuel prices and elevated cost of living are lifting the average new vehicle price to unheard of levels. It’s the more affluent buyers that prop up the market as entry-level customers are priced out of the new vehicle market. The year-to-date tally after 9 months is off -2% to 12,026,213 units, in a market buoyed by crossovers and hybrids. The September SAAR falls to 16.1 million vs. 17.1 million in August. Fleet volume is increasing, now standing at 20% of the total market over the first 9 months according to Cox Automotive: government and rentals are up 7% whereas retail sales to consumers fall -5%.
The return of the Cherokee isn’t enough to prevent Jeep sales freefalling.
Over Q3, Asian automakers are in shape whereas the Detroit 3 falls. Cox Automotive estimates a record-low 36% market share for the Detroit 3 over Q3. General Motors falls -5.4% to just under 670,000 sales, only 4% coming from electrified vehicles. In contrast edges up 0.6% over the quarter and is up +8.4% in September with hybrids and electrified models up 38% and accounting for 58% of the manufacturer’s September volume and 57% of Q3 deliveries. Ford Motor (-6.6%) falls for the third straight quarter, while Hyundai-Kia (+5.4%) impresses less than 1,200 units below. Hyundai is up 9.1% in September to 77,439 and Kia up 18% to 77,009, both September records. Meanwhile Honda Motor advances 9.3% and is up 16% in September for a 6th consecutive monthly gain. Stellantis (-0.3%) is stable as is Nissan Motor/Mitsubishi (+0.3%). The VW Group suffers at -12.3%.
Kia sales are up 18% to a record September.
Looking at brands over Q3, Toyota (+0.5%) remains by far in the lead above Ford (-6%) and Chevrolet (-4.4%) both in difficulty. Honda (+9.3%), Hyundai (+3.3%) and Kia (+7.8%) all outpace the market, Nissan (+0.2%) is stable ahead of Subaru (+4.5%) and GMC (-4.7%) with Tesla (-3.5%) rounding out the Top 10. Ram (+29.3%) delivers the biggest gain in the Top 30 but fails to crack the Top 10. Stellantis stablemate Jeep (-19.9%) is in complete freefall. Other solid performers below include BMW (+3.4%), Mercedes (+3.4%), Buick (+7.9%) snapping a streak of four consecutive quarterly declines, Chrysler (+6.4%) and Acura (+9.9%).
The Honda CR-V is the best-selling SUV in the U.S. so far this year.
Model-wise, after falling -11% over Q2, the Ford F-Series (-1.9%) rebalances itself now aluminium parts supply has recovered. It sells over 203,000 units over the period vs. 197,900 in Q2. The Chevrolet Silverado (+3.3%) defies high fuel prices to manage a YoY gain, while the Ram Pickup shoots up 33.7% to reclaims the third place overall, held for the last time over a Full Year in 2023. The return of the 5.7-litre Hemi V8 has proved a success. The Honda CR-V (+16.6%) takes advantage of a sluggish generation transition from the Toyota RAV4 (-16%) to hold onto the #1 SUV spot, just ahead of the Tesla Model Y (+27.9%). The Toyota Camry (+3.2%) tops sedans at #8 overall ahead of the Toyota Corolla (+6.4%) at #13 and the Honda Civic (+10%) at #14.
Previous month: USA August 2026: Weak market (-5.6%), Subaru, American Honda up, Ford down -10.2%
One year ago: USA Q3 2025: EVs push market up, Stellantis back in positive, Chevrolet Equinox surges
Full Q3 2026 Top 15 OEMs, Top 48 brands and Top 302 All models below.
USA Q3 2026 – OEMs:
PosOEMQ3 2026/251-9 2026/25PosFY251General Motors669,961– 5.4%2,005,422– 6.3%112Toyota Motor633,223+ 0.6%1,876,613+ 0.6%223Ford Motor Co507,395– 6.6%1,508,357– 8.6%334Hyundai-Kia506,200+ 5.4%1,426,583+ 3.9%445American Honda392,341+ 9.3%1,149,261+ 4.7%556Stellantis324,857– 0.3%960,587+ 3.1%667Nissan Motor Group/Mitsubishi245,017+ 0.3%784,834– 0.1%778Subaru166,538+ 3.3%473,878– 1.9%889Tesla144,300– 3.5%369,300– 8.7%101010Volkswagen Group135,316– 12.3%401,850– 8.1%9911Mazda108,434– 0.9%310,268– 2.9%111212BMW Group107,176+ 2.5%308,687+ 3.4%121113Mercedes-Benz85,800+ 3.4%248,800+ 3.3%131314Volvo Cars23,766– 8.7%80,645– 11.1%141415JLR19,900– 28.3%66,400– 29.2%1515
USA Q3 2026 – brands:
PosBrandQ3 2026/251-9 2026/25PosFY251Toyota540,167+ 0.5%1,613,845+ 1.2%112Ford487,907– 6.0%1,438,870– 8.5%223Chevrolet436,308– 4.4%1,297,869– 5.3%334Honda358,388+ 9.3%1,045,593+ 4.7%445Hyundai246,896+ 3.3%697,464+ 2.8%556Kia236,659+ 7.8%667,386+ 4.9%777Nissan210,635+ 0.2%675,396+ 0.3%668Subaru168,538+ 4.5%475,878– 1.5%899GMC157,103– 4.7%472,259– 1.8%9810Tesla144,300– 3.5%369,300– 8.7%121111Ram134,072+ 29.3%369,379+ 20.0%111212Jeep128,542– 19.9%413,762– 8.0%101013Mazda108,434– 0.9%310,268– 2.9%131314BMW100,210+ 3.4%287,154+ 4.3%141415Lexus93,056+ 1.6%262,768– 2.9%151516Mercedes85,800+ 3.4%248,800– 1.0%161617Volkswagen78,179– 10.9%241,141– 2.4%171718Buick43,990+ 7.9%135,811– 13.4%181819Audi39,751– 15.0%107,667– 16.3%192020Chrysler34,494+ 6.4%101,627+ 12.7%212221Acura33,953+ 9.9%103,667+ 4.4%202122Cadillac32,560– 30.0%99,483– 25.0%221923Dodge26,546+ 1.6%71,038– 3.5%242624Volvo23,766– 8.7%80,645– 11.1%232325Genesis22,645+ 5.5%61,733+ 4.9%282826Lincoln19,488– 18.0%69,487– 11.8%252427Mitsubishi18,543– 5.6%68,554– 6.6%262528Land Rover18,300– 29.6%63,200– 27.5%272729Porsche16,026– 12.9%49,038– 14.1%292930Infiniti15,839+ 20.4%40,887+ 5.8%303031Rivian9,295– 18.0%27,495– 9.4%313132Mini6,531– 10.2%20,248– 7.4%323233Lucid3,600+ 56.5%9,000+ 57.9%333334Ineos1,900+ 46.2%4,700+ 20.5%343635Polestar1,900+ 38.2%4,350– 11.7%353736Jaguar1,600– 9.1%3,200– 51.2%363537Ferrari860+ 2.4%2,490+ 6.2%373838Lamborghini820+ 22.4%2,170– 5.4%404039VinFast800+ 45.5%1,400– 20.2%434340Maserati580– 38.9%2,180– 38.6%394141Alfa Romeo569– 64.7%2,316– 51.5%383442Bentley540– 25.0%1,835– 17.2%413943Aston Martin500+ 25.0%1,535+ 12.0%424244Rolls Royce435+ 3.6%1,285+ 9.8%444445Lotus355– 22.8%665– 44.1%464646McLaren250– 13.8%765– 11.0%454747Fisker75– 62.5%325– 51.5%474848Fiat54– 83.2%285– 77.0%4845
USA Q3 2026 – models:
PosModelQ3 2026/251-9 2026/25PosFY251Ford F-Series203,707– 1.9%561,508– 9.5%112Chevrolet Silverado146,154+ 3.3%418,710– 1.6%223Ram Pickup117,757+ 33.7%325,348+ 24.0%454Honda CR-V110,730+ 16.6%336,844+ 9.5%345Tesla Model Y110,000+ 27.9%265,000+ 14.0%566Toyota RAV499,709– 16.0%253,664– 29.2%837GMC Sierra86,590– 2.5%257,344– 0.3%778Toyota Camry81,640+ 3.2%260,684+ 11.2%699Toyota Tacoma71,027– 3.5%214,875+ 5.1%91010Chevrolet Equinox69,108– 30.0%209,732– 18.2%10811Nissan Rogue66,021+ 26.3%201,991+ 24.8%111512Hyundai Tucson64,075+ 23.4%181,687+ 10.0%151313Toyota Corolla63,738+ 6.4%195,141+ 8.4%121114Honda Civic62,695+ 10.0%195,135+ 5.4%131215Ford Explorer62,285+ 11.2%189,210+ 17.6%141416Chevrolet Trax57,917+ 16.3%167,910– 0.9%161717Honda Accord 55,453+ 32.9%145,521+ 32.7%192718Kia Sportage50,839+ 8.3%145,746+ 8.7%181919Subaru Crosstrek50,626– 3.4%138,249– 3.1%211820Hyundai Elantra48,764+ 17.7%128,603+ 10.7%232521Subaru Forester48,622+ 31.2%156,476+ 17.6%172022Jeep Wrangler44,757+ 5.4%131,011+ 2.3%222223Ford Maverick41,970+ 20.4%123,681+ 2.3%242624Subaru Outback41,801– 3.1%104,759– 10.0%362425Ford Transit40,260– 5.3%119,185+ 0.5%262326Honda HR-V40,235+ 11.0%108,609– 5.9%323027Hyundai Santa Fe39,112+ 5.5%103,115+ 0.9%373428Chevrolet Traverse38,754– 0.3%120,171+ 16.0%253129Jeep Grand Cherokee38,027– 30.3%139,764– 9.4%201630Ford Bronco38,020+ 0.4%114,956+ 4.6%273331Kia K437,633+ 17.2%111,212+ 3.3%293532Nissan Sentra36,890– 8.3%112,439– 10.6%282833Kia Telluride36,436+ 17.6%110,038+ 19.0%314134Toyota Tundra35,712– 0.7%110,080– 0.8%302935Toyota 4Runner35,667– 3.2%107,987+ 61.2%345436Hyundai Palisade35,229– 1.0%98,682+ 6.4%394037Ford Bronco Sport34,751+ 12.7%106,238+ 2.9%353838Chrysler Pacifica/Voyager34,491+ 23.1%101,611+ 18.4%384539Mazda CX-533,070– 6.9%95,762– 9.5%403740Toyota Grand Highlander32,990– 4.1%108,511+ 8.7%333641Chevrolet Trailblazer 31,075+ 51.1%90,891+ 21.1%435242Mazda CX-5030,532– 6.7%95,351+ 19.7%414443Lexus RX29,920+ 8.6%89,824+ 11.7%454344Honda Pilot29,584+ 0.6%92,967– 1.7%423945Toyota Sienna29,518+ 27.7%84,770+ 11.7%475346Tesla Model 329,000– 42.8%71,000– 47.1%532147Toyota Corolla Cross28,590+ 29.9%90,131+ 22.9%444748VW Tiguan28,091+ 27.4%81,021+ 65.5%496049Kia Sorento27,857+ 20.6%77,205+ 4.3%515550Nissan Kicks26,645+ 1.5%82,413+ 7.5%484851Kia Seltos25,703+ 69.9%58,207+ 45.3%657552Chevrolet Colorado25,170+ 2.4%72,863– 5.8%524653Chevrolet Tahoe24,918– 2.6%79,570– 7.1%504254Nissan Frontier23,412+ 37.5%66,513+ 39.6%547155Nissan Pathfinder23,311– 9.5%87,382+ 20.9%465156Mercedes GLE23,245+ 30.9%60,253+ 27.7%626857Honda Odyssey23,140+ 10.6%65,986– 7.0%565858Dodge Durango22,755+ 13.7%61,330+ 12.7%595959BMW X322,457+ 7.0%60,128+ 20.2%636760BMW X522,213+ 21.5%63,767+ 22.9%576361GMC Yukon/XL21,583+ 8.0%66,065– 3.1%55n/a62Kia Carnival21,472+ 18.9%61,540+ 20.2%586663Kia K520,287+ 12.6%58,681+ 11.6%646564Ford Expedition19,860– 9.1%60,271– 9.5%615765GMC Terrain19,396– 11.8%61,184+ 12.6%606466Lexus NX19,385+ 2.0%50,148– 12.4%726267Mercedes GLC19,091+ 0.6%53,986+ 11.7%687268Buick Envista18,094+ 18.4%48,139+ 4.1%737669Ford Ranger17,561+ 14.8%51,630+ 6.9%716970Hyundai Sonata17,273+ 33.6%54,330+ 18.3%677371Honda Passport16,955+ 17.9%47,315+ 14.1%758472Hyundai Kona16,779– 3.8%52,948– 7.6%706173Ram ProMaster Van16,314+ 4.4%44,030– 2.8%767474VW Atlas15,375– 19.5%53,285– 1.7%694975Lexus TX14,562+ 1.1%42,674+ 7.9%798576Acura MDX14,485+ 63.5%38,586+ 25.2%8410377Nissan Altima14,136– 0.4%56,424– 26.0%665678VW Jetta14,092+ 24.9%41,606– 4.6%808979Mazda CX-9013,728– 17.5%34,999– 21.7%888780Chevrolet Express13,725– 15.0%39,143– 10.3%829481Honda Ridgeline13,538+ 3.3%37,028– 1.0%859582GMC Acadia13,449+ 7.7%39,930– 4.6%818683Subaru Ascent12,938+ 31.5%32,556+ 4.0%9310184Mazda CX-3012,770+ 5.0%34,386– 27.1%907985Jeep Wagoneer/Grand12,641+ 870.1%43,161+ 77.3%779386Mazda312,034+ 104.3%32,486+ 42.3%9412387Jeep Gladiator11,911– 9.2%30,944– 19.7%998288Nissan Murano11,890– 16.1%31,551– 2.6%9610489Audi Q511,371+ 17.0%33,509+ 2.7%929790BMW 3 Series11,256+ 46.4%29,987+ 37.3%10111991GMC Canyon11,246+ 17.9%33,545+ 20.3%9111392Chevrolet Suburban11,210– 11.1%35,920– 15.6%867793Cadillac Escalade11,195– 17.7%34,460– 17.4%8912094Toyota Highlander10,891– 13.7%42,950+ 0.6%788195Jeep Compass10,811– 61.5%47,837– 42.3%745096Hyundai Ioniq 510,382– 52.8%31,112– 24.3%989697Jeep Cherokee10,344+ 5646.7%20,945+ 4692.9%12631598Toyota Land Cruiser10,285+ 31.7%26,697– 24.0%1129999Ford Mustang9,960+ 7.5%38,685+ 17.9%83100100VW Taos9,780+ 0.4%27,569– 32.0%10688101Mitsubishi Outlander 9,765+ 0.4%27,962– 7.9%10598102Toyota Prius9,705– 25.0%29,223– 37.5%10380103Buick Encore GX9,617+ 5.4%35,770– 20.7%8778104Mercedes Sprinter9,600+ 2.7%27,500+ 10.5%108109105Toyota BZ/bZ4X9,437+ 213.0%27,544+ 124.6%107174106Genesis GV709,309– 3.0%26,908+ 4.5%111114107Ford E-Series9,245– 13.8%27,474– 9.0%109188108Lincoln Nautilus9,066+ 17.7%27,248+ 3.9%110117109Volvo XC608,900+ 3.3%29,804– 2.4%102107110Volvo XC908,761+ 4.7%31,299+ 11.3%97110111Hyundai Venue8,682+ 5.0%24,307+ 2.4%116115112Acura ADX8,657+ 22.0%25,211+ 114.5%114164113Buick Enclave8,523+ 3.4%30,726+ 7.3%100108114BMW 4 Series8,520+ 0.1%24,093– 24.4%117157115Kia Niro8,297– 0.3%22,064+ 9.7%122118116Lexus GX8,224– 12.1%23,205– 17.8%119112117Lexus IS8,186+ 70.2%22,257+ 51.7%121156118Infiniti QX607,828– 3.8%24,884+ 17.2%115125119Genesis GV807,817+ 14.4%20,981+ 9.6%125129120Buick Envision7,756– 4.6%21,176– 42.6%124102121BMW X77,575+ 7.3%20,197– 7.2%128122122Mercedes C Class7,545+ 0.7%20,937– 1.1%127124123Toyota Sequoia7,464+ 19.2%21,403+ 15.8%123134124BMW X17,458+ 4.2%22,476+ 9.7%120130125Audi Q36,960+ 24.4%17,866– 1.9%137139126VW Atlas Cross Sport6,889– 9.5%23,549– 3.0%118121127Toyota Crown Signia6,752+ 69.0%17,983+ 10.5%135149128Chevrolet Corvette6,585+ 28.5%20,002+ 12.9%130140129Chevrolet Blazer6,460– 66.2%32,336– 45.7%9570130Lexus ES6,437– 39.3%10,333– 65.3%170105131Nissan Armada6,356+ 43.2%16,361+ 29.8%143163132Mercedes GLB6,323+ 171.3%12,986+ 57.6%155191133Audi Q76,071+ 41.8%13,754– 3.5%152158134BMW 5 Series6,016– 20.6%18,489– 12.0%132155135Acura Integra6,013+ 27.5%20,100+ 37.3%129151136Mitsubishi Outlander Sport5,902+ 91.6%26,410+ 130.3%113145137Porsche Cayenne5,837+ 35.9%15,622+ 6.8%144154138Ford Mustang Mach-E5,574– 72.4%17,206– 59.0%14091139Porsche Macan5,519– 16.4%17,071– 19.3%141133140Cadillac XT55,423– 6.0%16,530– 10.6%142137141Kia EV95,394– 28.2%12,429– 0.2%158172142Audi A55,315+ 52.9%14,197+ 20.8%148169143Land Rover Defender5,200– 28.8%17,700– 28.6%138136144Range Rover Sport5,200– 21.2%17,900– 16.0%136142145Lincoln Navigator5,122+ 3.3%15,516– 5.2%145144146Range Rover 5,000– 30.6%17,700– 26.3%139138147Subaru WRX4,919+ 188.0%12,027+ 47.8%160196148Lincoln Aviator4,887+ 11.3%18,309+ 11.6%134141149Honda Prologue4,882– 75.9%13,289– 63.6%154106150Hyundai Santa Cruz4,830– 24.7%14,811– 28.2%147127151Tesla Cybertruck4,800– 32.4%13,800– 31.8%151126152Mercedes GLS4,792– 22.0%18,375+ 1.7%133131153Acura RDX4,781– 22.3%18,557– 22.8%131116154Ford Escape4,714– 85.3%28,826– 74.9%10432155Cadillac Optiq4,550– 6.9%11,633+ 18.4%163186156BMW 2 Series4,537– 9.7%13,443– 8.9%153153157Subaru Impreza4,357– 38.9%12,739– 42.4%156128158Infiniti QX654,271new5,527new202 –159Cadillac CT54,162+ 4.1%11,924– 2.0%161167160Mini Cooper S4,141+ 4.9%11,578– 5.0%164170161Audi Q84,095+ 103.0%10,439+ 33.0%168187162Rivian EDV4,000+ 33.3%6,630– 5.3%190192163Mercedes GLA3,930+ 3.4%10,666– 15.3%166165164Chevrolet Bolt3,866n/a8,090+ 6477.2%180 –165Genesis G703,860+ 22.7%9,440+ 14.0%175193166BMW X63,795+ 20.2%10,617+ 35.1%167190167Infiniti QX803,734+ 23.9%10,021+ 0.7%173179168Volvo XC403,727– 23.8%12,590– 31.5%157143169Mazda CX-703,712– 4.8%9,686– 21.0%174177170Dodge Charger3,679+ 22.1%8,796– 1.6%177218171Cadillac Lyriq3,617– 50.5%11,195– 32.7%165148172Toyota C-HR3,467+ 346600.0%7,215+ 721400.0%186361173GMC Savana3,416– 49.7%9,167– 46.9%176150174Porsche 9113,300– 4.3%11,778+ 32.8%162183175Subaru Trailseeker3,174new5,610#DIV/0!199 –176Mercedes E Class3,070+ 7.6%10,415– 2.3%169171177Mitsubishi Eclipse Cross2,875– 29.5%14,135+ 26.8%149159178Rivian R1S2,700– 58.5%14,100– 22.1%150135179Mercedes CLE2,667– 0.9%10,147+ 6.0%172173180Mazda MX-5 Miata2,588+ 2.4%7,598+ 4.1%184205181Cadillac Vistiq2,587– 34.1%6,490+ 14.5%193212182Audi A32,555+ 57.5%7,690+ 18.3%183209183BMW 7 Series2,539– 10.1%7,720– 9.5%182208184VW Golf2,531– 14.8%8,003– 4.5%181200185BMW X22,406+ 29.1%6,361+ 30.0%194220186Lexus RZ2,400+ 53.8%10,214+ 91.3%171223187Lucid Gravity2,400+ 1100.0%5,600+ 2700.0%200263188Mini Countryman2,390– 28.1%8,670– 10.4%178182189Kia EV62,221– 57.3%6,264– 43.5%195180190Mercedes S Class2,220+ 47.0%5,880+ 2.4%196211191Audi A61,971– 59.3%6,576– 23.4%191198192Ineos Grenadier1,900#DIV/0!4,700+ 80.8%204229193Lexus LX1,833+ 4.7%5,550+ 2.2%201217194Rivian R21,700new1,720new237 –195Lexus UX1,668– 12.1%7,050+ 2.2%187204196Hyundai Ioniq 91,663– 47.4%6,521+ 56.1%192233197Toyota GR861,635– 39.0%5,642– 30.4%197201198Toyota Crown1,531– 57.9%6,683– 23.1%189189199GMC Hummer pickup/SUV1,423– 72.9%5,024– 62.0%203168200Chevrolet BrightDrop 4001,344– 43.6%2,300– 42.2%225285201Lucid Air1,200– 42.9%3,400– 38.2%211203202Range Rover Velar1,200– 33.3%4,000– 43.7%207225203Honda Prelude1,176new2,899new217321204Polestar 4998new1,848new235336205VW ID.4989– 92.1%3,194– 85.6%213146206Genesis G80957+ 5.2%2,599– 6.1%220241207Volvo EX30926– 51.2%3,189– 28.6%214231208Polestar 3902– 30.6%2,502– 40.8%222239209Jaguar F-Pace900– 18.2%2,160– 36.5%229240210Subaru Uncharted894new3,385new212 –211Rivian R1T875– 51.4%4,575– 10.3%205219212Mercedes G Class872– 72.4%7,009– 14.4%188181213Nissan Z834– 19.3%2,539– 47.3%221228214Porsche Panamera825+ 4.4%2,699– 20.9%219234215Audi Q6 e-tron810– 92.1%1,868– 89.2%234161216VinFast VF8800+ 100.0%1,170– 19.3%246275217Cadillac CT4793– 44.2%3,904– 4.0%208227218Ferrari car750+ 1.4%1,950– 6.3%233 –219Mercedes CLA728– 53.2%4,429+ 1.4%206214220Subaru BRZ682+ 31.4%2,234+ 2.3%227251221Nissan Leaf634– 12.4%2,318– 50.1%224230222Volvo EX90603– 36.5%1,754– 40.0%236242223Land Rover Discovery600– 33.3%2,300– 23.3%226248224Range Rover Evoque600– 50.0%2,000– 48.7%231244225Mercedes AMG GT596+ 32.7%2,044+ 2.1%230246226Porsche Taycan537– 65.4%1,616– 55.6%240235227Kia EV3520new520new269 –228Volvo S/V60510– 36.1%1,631– 61.7%239n/a229Land Rover Discovery Sport500– 50.0%1,600– 48.4%241245230Maserati Truck500– 25.4%1,650– 28.0%238 –231Nissan Versa499– 95.4%15,356– 63.0%14692232Subaru Solterra498– 85.7%5,635– 43.5%198197233BMW 8 Series484– 43.4%2,757– 3.7%218237234Audi A8464+ 30.3%977– 11.6%253271235Lamborghini Urus460+ 9.5%1,380– 1.1%242262236Lexus LC435+ 103.3%1,124+ 12.0%248276237VW ID.Buzz432– 82.5%2,913– 41.0%216226238Lincoln Corsair413– 93.8%8,414– 57.5%179132239BMW Z4406– 24.3%1,983+ 23.7%232259240Jaguar i-Pace400+ 33.3%450– 77.5%272260241Genesis G90371– 18.3%989– 14.8%252269242Bentley Car365– 29.8%1,240– 21.0%245 –243Aston Martin car360+ 44.0%1,075+ 26.5%251 –244Lamborghini car360+ 44.0%790– 12.2%257 –245BMW XM355– 12.8%1,141– 6.6%247266246Lotus car350– 22.2%655– 31.1%262n/a247Genesis GV60331– 38.2%816– 52.8%255261248Toyota Supra321– 58.7%2,437+ 21.3%223249249Mercedes EQS306– 10.0%570– 65.3%265265250Jaguar E-Pace300+ 200.0%390+ 5.4%274311251Mercedes SL Class300+ 32.7%1,305+ 53.7%244270252Mercedes EQS SUV297– 42.3%626– 77.9%263258253McLaren Car250– 13.8%765– 11.0%258 –254Rolls Royce Cullinan250+ 13.6%755+ 19.8%259290255Tesla Model S250– 88.6%7,250+ 8.9%185206256Tesla Model X250– 92.9%12,250+ 14.7%159178257Cadillac XT6222– 94.2%3,126– 76.8%215166258Alfa Romeo Stelvio219– 43.1%953– 36.9%254264259Alfa Romeo Tonale199– 79.1%693– 67.1%260256260Volvo EX40196n/a196n/a287286261Mercedes EQE SUV187– 84.5%1,122– 80.9%249236262Rolls Royce car185– 7.5%530– 1.9%268 –263Bentley Bentayga175– 12.5%595– 7.8%264288264Alfa Romeo Giulia151– 47.2%670– 42.6%261272265Aston Martin DBX140– 6.7%460– 11.5%271300266Volvo EX60137new137new290 –267BMW iX121– 96.1%3,566– 63.9%209185268Ferrari Purosangue110+ 10.0%540+ 103.8%266303269Hyundai Ioniq 6107– 96.2%1,348– 85.2%243199270Audi e-Tron GT102– 84.4%272– 75.8%279280271Dodge Hornet85– 97.0%802– 90.5%256202272Toyota Mirai83– 25.2%212+ 34.2%285320273Maserati Car80– 71.4%530– 56.3%267 –274Fisker Ocean75– 62.5%325– 51.5%277284275BMW X472– 96.1%429– 91.3%273224276Fiat 50052– 81.9%201– 81.3%286278277Jeep Recon35+ 150.0%82+ 141.2%299344278Audi A728– 90.6%349– 74.9%275267279Dodge Challenger27– 87.8%110– 93.6%292 –280Subaru Legacy27– 99.5%2,208– 87.0%228152281Chevrolet Malibu22– 97.8%228– 97.6%283194282Rivian RCV20– 50.0%470+ 213.3%270333283Mercedes EQE17– 96.3%126– 94.6%291255284Acura TLX16– 99.4%1,104– 82.0%250215285Jeep Renegade16– 84.6%49– 92.9%301294286Mercedes EQB SUV14– 99.3%324– 94.4%278210287Cadillac XT411– 99.4%221– 97.9%284195288Audi Q4 e-tron9– 99.7%167– 97.5%288216289Porsche 718 Boxster8– 99.5%252– 95.3%280247290Infiniti QX506– 99.6%348– 93.0%276222291Volvo S/V906– 98.8%45– 97.2%302283292Lotus Truck5– 50.0%10– 50.0%307 –293Toyota Venza5– 54.5%11– 98.4%306279294Lexus LS4– 98.0%150– 83.2%289282295Nissan Ariya4– 99.9%94– 99.4%297175296Chrysler Town & Country3n/a3n/a309 –297Nissan Titan3– 97.5%13– 99.4%305252298Fiat 500X2– 93.5%73– 53.8%300322299Lexus RC2– 99.3%239– 77.9%281273300Acura ZDX1– 99.9%109– 99.1%294184301Mitsubishi Mirage1– 100.0%44– 99.7%303162302Ram ProMaster City1– 94.4%1– 94.7%316 –
Source: Automakers

More Stories
India September 2026: Record market (+20.9%), Kia, Maruti Suzuki Baleno at record high
The Maruti Suzuki Baleno is the best-selling vehicle in India in September. The Indian wholesales market continues on its fantastic...
China new models September 2026: Hongqi G919, VW ID.AURA T6 and Hyundai Ioniq V arrive
Hongqi G919 Now that September 2026 wholesales have been covered, let’s focus on the latest launches on the Chinese market....
Fuel Crisis Accelerates Fall in Used Diesel Values
Soaring fuel prices are accelerating the decline in used diesel car values, with prices down 6.9% over the past 12...
Best Car Accident Attorneys in Illinois
A car accident can create challenges that extend well beyond vehicle repairs. Injured drivers and passengers may face medical expenses,...
Acura Confirms Three New SUVs Including Adventure-Ready Model, Larger 8-Passenger SUV, and 2028 RDX Hybrid
Acura is preparing for a major expansion of its SUV lineup, and the brand’s latest announcement gives us a much...
DeLorean Is Finally Taking Flight With a Real Flying Car Racing Team, Just Like Back to the Future Imagined
If there’s one automotive name that deserves to be associated with flying cars, it’s DeLorean. After all, anyone who grew...