
Finland September 2026: Tesla Model Y at highest in 3 years

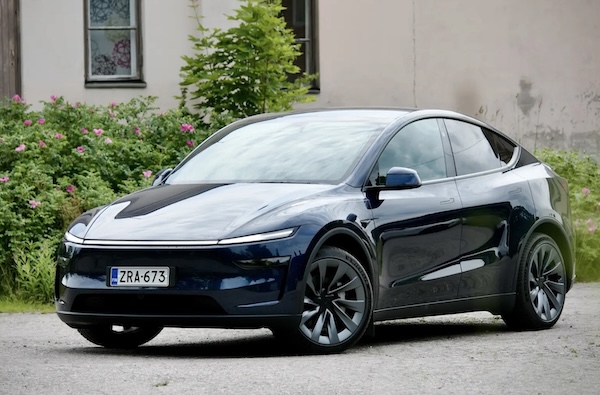
The Tesla Model Y holds 9.1% of the Finnish market in September.
It’s another very satisfying month for new car sales in Finland, up 17.2% year-on-year in September to 6,917 units. This leads to a year-to-date tally up 5.8% to 55,969. After a record August result at 25.1% share, Toyota (+5.5%) falls back to a down-to-earth 14.1%, well below the 18.4% it commands YTD. Meanwhile Tesla (+31.3%) jumps 12 spots on August to #2 with 798 sales and 11.5% share. This is the American carmaker highest position in a year (#2 in September 2025), largest volume in 3 years – since September 2023 (1,202) and highest share since December 2023 (11.8%). Volkswagen is stable at #3, just above Kia (+22.3%) and Skoda (-0.6%). Audi (+81.9%), Ford (+44.3%), Mercedes (+39.1%) and BMW (+27.4%) also shine in the remainder of the Top 10. Xpeng is up to #25 and cracks the YTD Top 30 (#29).
Finland is yet another market dominated by the Tesla Model Y this month thanks to sales up 22.8% to an extravagant 9.1% share. This is the nameplate’s fifth win in the past 10 months and its highest share in 3 years – since September 2023 (15.4%). The Toyota bZ4X (+5675%) repeats at #2 and advances to #3 in the year-to-date charts as a result. The Toyota C-HR (+90.4%) rounds out the podium ahead of a surging Tesla Model 3 (+76.8%). The Toyota RAV4 (-11%) reenters the Top 10 for the first time since last November at #6. Notice also the Audi Q4 up 221.3% to a record 7th place for its third ever Top 10 finish (alongside #10 in May and October 2023) and the Mercedes GLC up 360% to #10.
Previous month: Finland August 2026: Toyota up to record 25.1% share, monopolises Top 5
One year ago: Finland September 2025: Tesla Model Y (+88.6%) lodges best result in two years
Full September 2026 Top 30 brands and Top 20 models below.
Note: These rankings feature the year-to-date Top 30 brands and models ordered based on their September sales and may therefore not be 100% accurate.
Finland September 2026 – brands:
PosBrandSep-26%/25Aug2026%/25PosFY251Toyota97514.1%+ 5.5%110,28918.4%+ 26.2%112Tesla79811.5%+ 31.3%143,2135.7%+ 75.4%8103Volkswagen5257.6%+ 0.0%25,4669.8%– 11.5%224Kia5217.5%+ 22.3%73,4306.1%– 23.1%655Skoda5117.4%– 0.6%44,9688.9%– 1.9%336Mercedes4917.1%+ 39.1%33,5766.4%+ 44.3%577BMW3955.7%+ 27.4%53,2755.9%+ 21.4%768Volvo3745.4%– 8.6%64,0197.2%– 9.4%449Ford3394.9%+ 44.3%92,0593.7%– 5.5%10910Audi3314.8%+ 81.9%82,7314.9%+ 24.7%9811Nissan2353.4%+ 11.9%171,3222.4%– 32.1%111112Polestar1271.8%– 4.5%119661.7%– 12.7%131313BYD1101.6%+ 11.1%159231.6%+ 147.5%141814Cupra1031.5%+ 157.5%107481.3%+ 97.9%162315Renault1031.5%+ 53.7%168721.6%– 20.2%151416Subaru1011.5%+ 206.1%284420.8%+ 50.3%242817Dacia981.4%+ 12.6%204940.9%– 20.8%211518Hyundai931.3%– 23.8%131,0751.9%– 38.4%121219Peugeot891.3%+ 134.2%126731.2%+ 8.5%171620Suzuki741.1%+ 1.4%264480.8%– 3.9%232121Mazda560.8%– 27.3%225671.0%– 1.6%191722Citroen550.8%+ 111.5%194820.9%– 3.8%221923MG540.8%+ 10.2%214400.8%+ 14.3%252224Lexus510.7%+ 13.3%234090.7%+ 23.6%272625Xpeng510.7%n/an/a2170.4%+ 201.4%29n/a26Mitsubishi450.7%– 2.2%244140.7%– 23.9%262027Smart450.7%+ 7.1%256081.1%+ 188.2%182428Opel350.5%+ 34.6%185631.0%+ 62.7%202529Porsche300.4%+ 11.1%272920.5%– 12.3%282730Land Rover270.4%– 28.9%n/a2090.4%– 25.1%3029
Finland September 2026 – models:
PosModelSep-26%/25Aug2026%/25PosFY251Tesla Model Y6309.1%+ 22.8%n/a2,3664.2%+ 77.2%252Toyota bZ4x2313.3%+ 5675.0%21,9013.4%+ 372.9%3n/a3Toyota C-HR1982.9%+ 90.4%31,4162.5%+ 40.2%6124Tesla Model 31682.4%+ 76.8%n/a8351.5%+ 71.5%16245Nissan Qashqai1582.3%+ 6.8%n/a9371.7%– 25.2%1396Toyota RAV41532.2%– 11.0%n/an/an/an/an/a47Audi Q41512.2%+ 221.3%176441.2%+ 5.9%22198Skoda Enyaq1502.2%+ 37.6%121,2072.2%– 3.7%969Toyota Yaris1482.1%– 55.8%41,8603.3%+ 3.6%4210Mercedes GLC1382.0%+ 360.0%67851.4%+ 99.2%17n/a11Kia Stonic1321.9%+ 94.1%n/a6651.2%+ 10.5%212312Skoda Elroq1311.9%– 13.2%81,2532.2%+ 19.4%81113BMW i41291.9%+ 101.6%79081.6%+ 91.2%142614Mercedes CLA1261.8%+ 51.8%101,3042.3%+ 512.2%7n/a15Volvo XC601151.7%+ 2.7%141,1642.1%– 10.3%10716Toyota Corolla1021.5%– 42.0%51,6342.9%+ 11.5%5317Ford Explorer1001.4%+ 58.7%205381.0%+ 45.0%28n/a18VW ID.4931.3%– 25.6%111,0781.9%– 15.3%11819Toyota Yaris Cross891.3%– 23.3%12,6604.8%+ 49.9%1120Volvo EX40841.2%+ 7.7%168581.5%+ 34.1%1516n/aKia EV3831.2%– 20.2%136751.2%– 13.1%2014n/aVW ID.7821.2%– 25.5%157501.3%– 27.7%1813n/aBMW iX3701.0%n/a96151.1%+ 4630.8%25n/an/aAudi Q6671.0%+ 97.1%186381.1%+ 48.0%23n/an/aPolestar 4650.9%+ 3.2%n/a5721.0%+ 1.2%2720n/aSkoda Octavia580.8%+ 31.8%n/a7391.3%+ 5.7%1915n/aVW T-Roc550.8%+ 189.5%n/a1,0381.9%+ 334.3%12n/an/aVolvo EX30510.7%+ 75.9%195811.0%+ 31.7%2630n/aVW Golf410.6%– 22.6%n/a6171.1%– 6.9%2421n/aSmart #5360.5%+ 24.1%n/a5361.0%+ 724.6%29n/an/aVW Tiguan280.4%– 45.1%n/a4940.9%– 35.1%3017
Source: AUT

More Stories
Portugal September 2026: Tesla hits record volume and share, Omoda 5 in Top 10
The Tesla Model 3 holds a record 10.5% of the Portuguese market in September. Portuguese new car sales shoot up...
Japan September 2026: Mitsubishi (+20.5%), Nissan (+17.6%) shine, Land Cruiser, Jimny break records, BYD Racco up
Mitsubishi Delica Mini sales are up 49.5% in September. 433,683 new vehicles found a buyer in Japan in September, a...
Romania September 2026: BYD up to #4, Toyota (+37.1%) shines in market off -11.2%
The BYD Seal U ranks #8 in Romania in September. Paltry result once again for Romanian new car sales in...
A Smart Shopper’s Guide to Buying a Used Chrysler
Chrysler has long stood for comfortable, family-friendly driving, from roomy sedans to the minivans that have defined family travel for...
2027 Mini Countryman Untamed Brings More Ground Clearance and Trail-Ready Style
Mini has spent decades building cars with plenty of personality, but serious off-road intent has rarely been part of the...
How Insurance Companies Evaluate Car Accident Injury Claims in Lawrenceville
Image source After a car accident, the insurance company does not pull a number out of thin air. Adjusters follow...