
Italy September 2026: Peugeot 3008 up to record #3, BYD (+108.8%) and Omoda/Jaecoo (+185.9%) surge

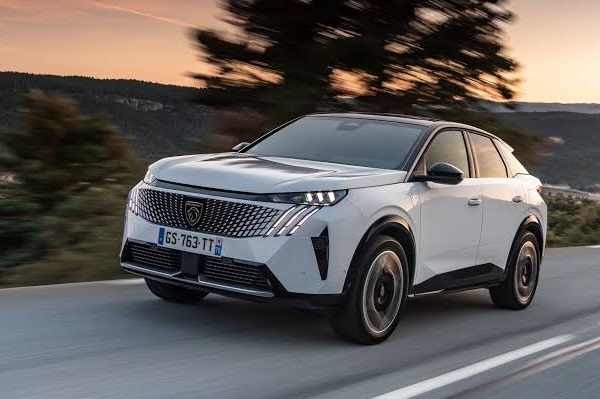
Peugeot 3008 sales are up 148% year-on-year in September.
The Italian new car market gains a sturdy 9.9% year-on-year in September to 139,356 units, bringing the year-to-date tally up 8.7% to 1,268,964. We however remain -13.6% below the pre-pandemic figure of 9 months 2019. Private sales grow 10.3% to 78,899 and 55.9% share vs. 55.8% a year ago (+10.7% to 53.6% YTD), self registrations soar 11.7% to 19,682 and 13.9% share vs. 13.7% last year (+6.1% to 11.3% YTD), long term leases edge up 3.8% to 30,408 and 21.5% share vs. 22.9% a year ago (-1.7% to 21.1% share YRD), short term rentals surge 91.1% to 4,132 and 2.9% share vs. 1.7% in September 2025 (+43% to 8.7% share YTD) and company sales are up 7% to 8,056 and 5.7% share vs. 5.9% last year (+1.6% to 5.3% share YTD).
HEV sales are up 23.6% to 71,604 and 50.7% share vs. 45.2% a year ago, including 26,193 full hybrids (+59.1%) and 45,411 mild hybrids (+9.55). PHEVs soar 43.8% to 15,669 and 11.1% share vs. 8.5% last year and BEVs shoot up 49.9% to 10,782 and 7.6% share vs. 5.6% a year ago. This means rechargeable vehicles see their sales grow 46.2% year-on-year in September to 26,451 and 18.7% share vs. 14.1% last year. Year-to-date, BEVs advance 66.9% to 102,257 and 8% share vs. 5.2% over the same period in 2025 while PHEVs are up 73% to 122,495 and 9.5% share vs. 6% last year.
The 500 (+1387.1%) helps pull Fiat up 29% this month.
Looking at the brands charts, local behemoth Fiat (+29%) spectacularly rallies back up year-on-year to 11.4% share, with a very similar YTD performance: +28.8% to 11.4% also. Toyota (+6.7%) overtakes Volkswagen (-7.6%) to return to the 2nd place it holds year-to-date. Peugeot (+34.1%) is back up five spots on last month to #5, distancing a struggling Dacia (-13.2%) and a strong Renault (+15.3%). BYD (+108.8%) reenters the Top 10 at #9, its highest ranking in Italy also reached last December, May and June. After a record 8th place finish in August, Omoda/Jaecoo (+185.9%) falls back to a still spectacular #11. Leapmotor (+452.5%), Land Rover (107.2%) and Tesla (+47%) stand out below.
Model-wise, the Fiat Panda (+35.3%) widens the gap with the other nameplates in the market with 7.4% share, well above the 6.8% it holds year-to-date. The Jeep Avenger (-15.3%) is in bad shape but climbs back up two spots on last month to #2. The performer of the month is the Peugeot 3008 (+148%) shooting up 30 spots on August to #3, its first time on the podium vs. a previous best of #4 reached in May 2023. The Dacia Sandero (-10%) disappoints at #4 while the Toyota Yaris Cross (+19.1%) is back up 7 spots on August to #5. The Fiat Grande Panda (+22.4%) confirms its lukewarm reception at home. After cracking the Top 10 for the first time in August, the BYD Seal U (+15.8%) is down to a still sensational #13. Below, the Leapmotor B10 is up to #43 and the Jaecoo 5 breaks into the Top 50 for the first time at #45.
Previous month: Italy August 2026: Omoda/Jaecoo and BYD Seal U in Top 10 for the first time
One year ago: Italy September 2025: Fiat Grande Panda breaks into Top 10
Full September 2026 Top 60 All brands and Top 50 models below.
Italy September 2026 – brands:
PosBrandSep-26%/25Aug2026%/25PosFY251Fiat15,90611.4%+ 29.0%1144,41311.4%+ 28.8%112Toyota10,6577.6%+ 6.7%389,5347.1%– 0.9%223Volkswagen8,8496.3%– 7.6%285,6446.7%+ 1.0%334Peugeot7,2605.2%+ 34.1%960,3274.8%– 2.9%555Dacia6,7204.8%– 13.2%468,2855.4%– 9.6%446Renault6,1934.4%+ 15.3%560,2714.7%+ 5.3%667Audi5,9024.2%– 1.4%758,2464.6%+ 11.6%788BMW5,5584.0%– 8.1%654,6144.3%– 1.3%879BYD5,1593.7%+ 108.8%1141,7083.3%+ 180.4%122110Jeep4,8423.5%– 12.7%1445,4853.6%– 9.5%9911Omoda+Jaecoo4,6493.3%+ 185.9%832,2052.5%+ 248.5%162512Kia4,6213.3%+ 14.2%1038,6133.0%+ 14.5%141513MG4,6193.3%+ 21.2%1242,0313.3%+ 7.5%111314Mercedes4,5943.3%– 3.9%1741,5893.3%+ 2.8%131215Citroen3,8012.7%– 1.4%1343,9293.5%+ 1.5%101116Ford3,2312.3%– 25.0%1538,2393.0%– 23.4%151017Skoda3,1662.3%– 4.7%1629,4222.3%+ 3.0%181618Hyundai3,0992.2%– 20.9%1925,6492.0%– 28.2%201419Suzuki3,0392.2%– 1.3%2123,6151.9%– 3.8%221920Nissan2,8552.0%+ 23.9%2225,6102.0%+ 0.9%211821Opel2,7652.0%– 9.2%1830,6382.4%+ 4.2%171722Leapmotor2,1991.6%+ 452.5%2428,4482.2%#DIV/0!193223Tesla2,1321.5%+ 47.0%3210,4220.8%+ 18.6%282724Cupra1,9581.4%+ 3.9%2016,9621.3%+ 6.3%232225DR Motor1,6481.2%+ 1.8%2310,8870.9%– 20.8%262326Mini1,4401.0%– 0.8%2613,3791.1%+ 19.5%252427Honda1,2060.9%+ 14.2%279,5820.8%+ 36.2%302928Volvo1,1990.9%+ 0.6%2910,5180.8%+ 1.1%272629Mazda1,1410.8%+ 33.6%289,6390.8%+ 23.5%292830Alfa Romeo1,1060.8%– 58.4%2516,0571.3%– 28.5%242031Lexus8360.6%+ 41.2%315,2760.4%+ 9.4%333632Seat8100.6%+ 30.9%346,2840.5%– 0.1%323133Land Rover7810.6%+ 107.2%365,1790.4%– 5.9%353434Geely7780.6%n/a393,9570.3%+ 28164.3%38n/a35Lancia6800.5%– 4.5%306,9690.5%– 4.9%313036Porsche4630.3%– 18.1%354,4910.4%– 11.4%363337EMC4310.3%+ 43.7%334,3180.3%+ 104.9%373838EVO3390.2%– 51.8%375,2150.4%+ 9.4%343539Deepal2620.2%new426880.1%new49 –40Dongfeng2490.2%+ 236.5%n/a1,8840.1%+ 1524.1%41n/a41Subaru1960.1%– 3.4%411,9780.2%+ 4.2%403942KGM1940.1%+ 373.2%401,6960.1%+ 152.8%425043Lynk & Co1590.1%+ 148.4%381,4600.1%+ 289.3%444544Mitsubishi1380.1%+ 165.4%446610.1%– 47.3%504245Maserati1330.1%+ 38.5%488810.1%– 37.1%464146DS1300.1%– 68.0%452,5900.2%– 32.2%393747Ich-X1130.1%+ 20.2%461,1270.1%+ 381.6%45n/a48Polestar1090.1%+ 45.3%535410.0%+ 47.8%534949Ferrari820.1%+ 10.8%508080.1%+ 26.4%474450Sportequipe760.1%– 52.5%471,6220.1%+ 7.3%434051Xpeng760.1%7500%n/a4860.0%+ 1418.8%55n/a52Lamborghini740.1%+ 12.1%525850.0%+ 24.7%524853SWM550.0%– 34.5%497890.1%+ 56.6%48n/a54Tiger470.0%+ 17.5%556190.0%+ 17.5%51n/a55Alpine450.0%+ 40.6%513470.0%+ 45.2%56n/a56Smart400.0%– 41.2%543280.0%– 49.2%574657DFSK190.0%– 75.6%435010.0%– 39.7%544358Lotus110.0%– 52.2%571230.0%– 37.9%585159Aston Martin80.0%+ 166.7%561010.0%+ 24.7%595360Jaguar00.0%#DIV/0! –70.0%– 96.2%605261Mahindra00.0%– 100.0% –10.0%– 99.8%6147 –Others5080.4%+ 1109.5% –1,4910.1%+ 17.6% – –
Italy September 2026 – models:
PosModelSep-26%/25Aug2026%/25PosFY251Fiat Panda10,3787.4%+ 35.3%186,3766.8%+ 5.4%112Jeep Avenger4,0922.9%– 15.8%436,0292.8%– 5.8%233Peugeot 30083,7802.7%+ 148.0%3316,2091.3%+ 28.5%24234Dacia Sandero3,7232.7%– 10.0%232,8312.6%– 15.0%325Toyota Yaris Cross3,6782.6%+ 19.1%1226,3172.1%– 2.0%656Fiat Grande Panda3,0922.2%+ 22.4%530,6512.4%+ 383.8%4377Toyota Yaris2,9392.1%+ 5.7%2022,5311.8%– 13.8%1168Renault Clio2,7011.9%+ 22.0%624,6801.9%+ 12.4%799Citroen C32,5721.8%+ 14.5%327,9692.2%– 9.2%5410MG ZS2,5101.8%+ 13.3%822,1721.7%– 3.5%121011Renault Captur2,3171.7%+ 16.5%1621,0801.7%+ 9.6%141312Dacia Duster2,2771.6%– 18.0%1121,5571.7%– 24.3%13713BYD Seal U2,1441.5%+ 15.8%712,4641.0%+ 13.4%282614Kia Sportage2,0881.5%+ 27.6%1018,0321.4%+ 20.9%162015Toyota Aygo X2,0421.5%– 8.3%1423,7281.9%+ 37.8%81416VW T-Roc1,9131.4%– 26.1%1320,5891.6%+ 3.1%151117Peugeot 2081,8781.3%– 1.2%923,0611.8%– 12.9%10818Opel Corsa1,8221.3%+ 11.4%1917,2751.4%– 2.2%191819BMW X11,7941.3%+ 9.1%2116,5191.3%+ 0.9%231620Nissan Qashqai1,7831.3%+ 43.2%4214,9861.2%+ 10.3%252221VW T-Cross1,7161.2%+ 16.5%1718,0101.4%+ 8.8%171722Audi A31,6241.2%+ 30.9%2710,0800.8%– 13.8%382523VW Tiguan1,5981.1%– 28.0%2316,9781.3%– 6.6%201524Fiat 5001,5021.1%+ 1387.1%2812,8661.0%+ 892.7%27n/a25Ford Puma1,4701.1%– 31.0%1817,7901.4%– 14.0%181226Omoda 51,4441.0%+ 246.3%1512,2171.0%+ 241.4%30n/a27Suzuki Swift1,4201.0%– 3.0%4011,2950.9%+ 30.0%333528VW Polo1,4131.0%+ 110.0%29n/an/an/an/an/a29Kia Picanto1,3981.0%– 1.3%2611,1910.9%+ 4.6%343030BYD Atto 21,3731.0%new4516,8531.3%new21n/a31Audi Q31,3671.0%+ 152.2%2216,7581.3%+ 102.4%224032Toyota C-HR1,3671.0%+ 16.1%2411,8900.9%– 2.3%312433Mercedes GLA1,2990.9%– 0.9%3810,3890.8%+ 7.1%363334Jaecoo 71,2330.9%+ 45.1%327,8120.6%n/a47n/a35Hyundai i201,1870.9%n/a447,7060.6%n/a48n/a36MG 31,1760.8%+ 15.6%2512,2481.0%+ 13.8%293137Peugeot 20081,1560.8%– 2.9%3013,5741.1%– 10.2%262138Tesla Model 31,1420.8%+ 74.1%n/a4,9390.4%+ 9.7%n/an/a39VW Golf1,0660.8%– 20.4%3110,7200.8%– 0.9%352940Suzuki Vitara1,0460.8%+ 1.1%n/a8,0650.6%+ 1.1%444141DR 51,0340.7%+ 10.6%343,6640.3%– 50.1%n/a4942Tesla Model Y9900.7%+ 24.7%n/a5,4220.4%+ 27.0%n/an/a43Leapmotor B109720.7%new463,5810.3%newn/a –44Hyundai Tucson9220.7%– 11.9%n/a10,0880.8%+ 2.4%373245Jaecoo 58910.6%newn/an/an/anewn/an/a46Audi Q58710.6%– 27.5%367,6950.6%+ 28.6%49n/a47Nissan Juke8630.6%+ 0.8%n/a8,1740.6%– 11.1%433448Skoda Kamiq8450.6%– 2.6%477,4680.6%– 8.6%503849Jeep Compass8350.6%n/a379,2650.7%+ 55.4%39n/a50Skoda Fabia7810.6%– 23.6%358,2180.6%– 4.2%4236n/aBMW X37680.6%– 19.0%487,8390.6%+ 12.7%4647n/aFord Kuga7410.5%+ 11.1%n/a7,9190.6%– 3.1%4543n/aAlfa Romeo Junior7150.5%– 32.9%398,5540.7%– 23.3%4128n/aFiat 6007010.5%– 46.0%4311,6340.9%– 32.8%3219n/aCitroen C3 Aircross6810.5%– 14.9%n/a9,2160.7%n/a40n/an/aLeapmotor T036450.5%+ 147.1%n/a23,1901.8%+ 1088.6%9n/a
Source: UNRAE
More Stories
Spain September 2026: Strongest market in 20 years, Tesla Model 3 signs first ever win
The Tesla Model 3 is the best-selling vehicle in Spain in August. New car sales in Spain are very strong...
2027 Ram 2500 Invoice Price, Dealer Cost, and How to Get the Best Deal Near You
The 2027 Ram 2500 is on dealer lots now with confirmed pricing and invoice data from iSeeCars across the full...
GM Keeps U.S. Sales Crown as Toyota Closes the Gap With Hybrid Momentum
General Motors remains the top-selling automaker in the United States after the third quarter of 2026, but Toyota is getting...
2027 Honda HR-V Invoice Price, Dealer Cost, and How to Get the Best Deal Near You
The 2027 Honda HR-V is one of the most important articles in this guide series to read before visiting any...
2027 Toyota Grand Highlander Woodland Adds Rugged Capability to the Family SUV
Toyota is giving its spacious three-row Grand Highlander a little more adventurous personality for 2027 with the arrival of the...
2026 Audi A6 allroad Invoice Price, Dealer Cost, and How to Get the Best Deal Near You
The 2026 Audi A6 allroad occupies a market position unlike any other vehicle in this guide series , a raised-suspension...