
Finland August 2026: Toyota up to record 25.1% share, monopolises Top 5

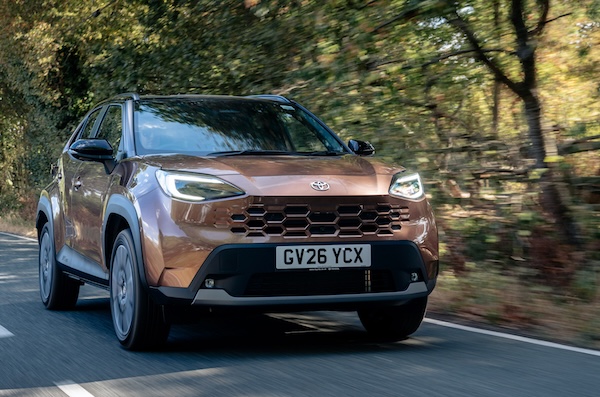
The Toyota Yaris Cross holds 9.6% of the Finnish market in August.
It’s a (rare) fantastic month for new car sales in Finland: up 27.3% year-on-year in August to 6,550 units. However keep in mind August 2025 was off -19.5% on the year prior. The year-to-date volume is now up 4.3% to 49,052. Toyota (+81.5%) surges ahead to reach an incredible 25.1% share, which is believed to be an all time record for the Japanese manufacturer in Finland (previous best 23.5% in January 2024). Volkswagen (+12.3%) is more modest at #2, followed by Mercedes (+128.1%) in outstanding shape. Skoda (-9.9%) disappoints while BMW (+29.8%) rounds out the Top 5. Cupra (+328.6%) and Audi (+63.2%) also shine in the remainder of the Top 10, with Peugeot (+197.3%), Citroen (+107.1%) and Lexus (+76.9%) also making themselves noticed below.
Model-wise, as expected Toyota monopolises the Top 5. The Yaris Cross (+206.8%) soars to a record 9.6% share (previous best 7.6% in October 2025), and distances the bZ4X (+1327.8%), C-HR (+75.4%), Yaris (+59.2%) and Corolla (+43.3%). The Mercedes GLC (+475.8%) is the best of the rest at #6 ahead of the BMW i4 (+123.8%) and Skoda Elroq (+3.7%). The BMW iX3 scores a third straight Top 10 finish at #9 above the Mercedes CLA (+436.4%). The Ford Explorer climbs back up to #20.
Previous month: Finland July 2026: Toyota at 23.4% share, BMW places i4 and ix3 in Top 5
One year ago: Finland August 2025: Toyota RAV4 repeats at #1, sales off -19.5%
Full August 2026 Top 30 brands and models below.
Finland August 2026 – brands:
PosBrandAug-26%/25Jul2026%/25PosFY251Toyota1,64125.1%+ 81.5%19,31419.0%+ 28.8%112Volkswagen5838.9%+ 12.3%24,94110.1%– 12.6%223Mercedes5117.8%+ 128.1%73,0856.3%+ 45.2%574Skoda4927.5%– 9.9%54,4579.1%– 2.0%335BMW4577.0%+ 29.8%32,8805.9%+ 20.6%766Volvo4256.5%+ 11.0%43,6457.4%– 9.5%447Kia3735.7%– 17.1%62,9095.9%– 27.9%658Audi3415.2%+ 63.2%82,4004.9%+ 19.5%989Ford2473.8%+ 6.0%91,7203.5%– 11.5%10910Cupra1201.8%+ 328.6%106451.3%+ 90.8%162311Polestar1121.7%+ 55.6%158391.7%– 13.9%131312Peugeot1101.7%+ 197.3%215841.2%+ 0.3%171613Hyundai1091.7%– 34.3%149822.0%– 39.5%121214Tesla1061.6%– 19.7%112,4154.9%+ 97.3%81015BYD1031.6%+ 53.7%128131.7%+ 196.7%141816Renault1031.6%+ 60.9%187691.6%– 25.0%151417Nissan911.4%– 40.9%131,0872.2%– 37.5%111118Opel721.1%+ 28.6%195281.1%+ 65.0%192519Citroen580.9%+ 107.1%174270.9%– 10.1%211920Dacia570.9%– 28.8%163960.8%– 26.3%221521MG550.8%+ 44.7%203860.8%+ 14.9%232222Mazda520.8%+ 6.1%255111.0%+ 2.4%201723Lexus460.7%+ 76.9%283580.7%+ 25.2%262624Mitsubishi420.6%– 42.5%273690.8%– 25.9%252025Smart370.6%+ 27.6%245631.1%+ 233.1%182426Suzuki330.5%– 13.2%233740.8%– 4.8%242127Porsche320.5%+ 3.2%222620.5%– 14.4%282728Subaru280.4%+ 40.0%263410.7%+ 30.7%2728n/aLand Rover80.1%– 72.4%291820.4%– 24.5%3029n/aSeat50.1%– 28.6%n/a1890.4%– 31.3%2930
Finland August 2026 – models:
PosModelAug-26%/25Jul2026%/25PosFY251Toyota Yaris Cross6299.6%+ 206.8%12,5715.2%+ 55.0%112Toyota bZ4x2573.9%+ 1327.8%31,6703.4%+ 319.6%4n/a3Toyota C-HR2143.3%+ 75.4%71,2182.5%+ 34.4%6124Toyota Yaris2073.2%+ 59.2%21,7123.5%+ 17.2%325Toyota Corolla2023.1%+ 43.3%121,5323.1%+ 18.8%536Mercedes GLC1902.9%+ 475.8%176471.3%+ 77.7%19n/a7BMW i41412.2%+ 123.8%47791.6%+ 89.5%13268Skoda Elroq1402.1%+ 3.7%151,1222.3%+ 24.9%8119BMW iX31292.0%n/a55451.1%+ 4092.3%23n/a10Mercedes CLA1181.8%+ 436.4%101,1782.4%+ 806.2%7n/a11VW ID.41161.8%– 24.2%89852.0%– 14.1%11812Skoda Enyaq1151.8%+ 5.5%141,0572.2%– 7.6%9613Kia EV31051.6%+ 28.0%195921.2%– 12.0%201414Volvo XC601031.6%– 8.8%91,0492.1%– 11.6%10715VW ID.71021.6%– 2.9%66681.4%– 27.9%171316Volvo EX40951.5%+ 75.9%207741.6%+ 37.7%151617Audi Q4901.4%+ 60.7%n/a4931.0%– 12.1%281918Audi Q6831.3%+ 56.6%165711.2%+ 43.8%22n/a19Volvo EX30801.2%+ 128.6%185301.1%+ 28.6%253020Ford Explorer771.2%n/an/a4380.9%+ 42.2%30n/an/aTesla Model 3681.0%+ 88.9%n/a6671.4%+ 70.2%1824n/aNissan Qashqai671.0%– 23.0%n/a7791.6%– 29.4%149n/aVW Golf620.9%+ 40.9%n/a5761.2%– 5.6%2121n/aVW T-Roc620.9%+ 210.0%139832.0%+ 346.8%12n/an/aSkoda Octavia580.9%– 10.8%n/a6811.4%+ 4.0%1615n/aPolestar 4550.8%+ 41.0%n/a5071.0%+ 1.0%2620n/aSkoda Fabia530.8%+ 32.5%n/a4340.9%+ 60.7%31n/an/aTesla Model Y380.6%– 60.4%111,7363.5%+ 111.2%25n/aKia Stonic370.6%– 44.8%n/a5331.1%– 0.2%2423n/aSmart #5310.5%+ 106.7%n/a5001.0%+ 1288.9%27n/an/aVW Tiguan220.3%– 62.7%n/a4661.0%– 34.4%2917
Source: AUT

More Stories
Everything You Need To Know About Private Number Plate Ownership
Deciding to invest in a private number plate is an exciting time for many, and the thought of finding a...
USA August 2026: Weak market (-5.6%), Subaru, American Honda up, Ford down -10.2%
The Maverick (+14.4%) can’t prevent Ford falling in August. Note: This update only features the brands still reporting monthly data....
Germany August 2026: BEVs up 75.1%, Mercedes GLC storms onto podium
First podium finish at home for the Mercedes GLC. The German new car market is up 2.6% year-on-year in August...
2026 Cadillac OPTIQ Invoice Price, Dealer Cost, and What You Should Pay Near You
The 2026 Cadillac OPTIQ is Cadillac’s answer to the question of what a compact luxury electric SUV should be, and...
Bulgaria August 2026: Skoda Kodiaq best-seller in market up 26.9%
The Skoda Kodiaq is the best-selling vehicle in Bulgaria in August. The Bulgarian new light vehicle market shoots up 26.9%...
Canada August 2026: Subaru (+31.8%) stands out in solid market
Subaru Forester sales are up 56.4% in August Note: This article only contains data for the brands reporting monthly. According...