
Australia August 2026: BEVs up 169.4% to outsell petrol at record 24.9% share, Geely breaks into Top 10

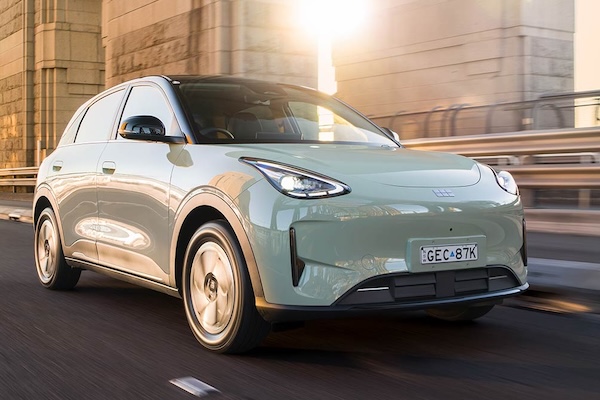
The Geely EX2 is up to #20 for its second month in market.
New vehicle sales in Australia are up 4.9% year-on-year in August to 108,760 units. This is the 2nd best August volume ever just below the 109,966 sales of August 2023. The year-to-date tally is up 2% to a new record 848,918, eclipsing the previous best of 836,065 from 2024. The biggest event of the month is the fact that BEVs are now the most popular fuel type in the country, shooting up 169.4% to 27,028 units and 24.9% share, a new record, vs. just 9.7% in August 2025 and 5.8% two years ago. As a reminder the BEV share record stood at 11.8% as recently as last February. This is a major market shift for Australia where we witness first hand the consequences of high fuel prices in the wake of the war in Iran. Year-to-date BEV sales are up to 154,304 and 18.2% share. Meanwhile petrol falls -32.6% to 25,824 (243,673 YTD), diesel drops -22.5% to 23,608 (207,541 YTD), HEVs gain 7.4% to 18,562 (142,210 YTD) and PHEVs soar 171.1% to 10,591 (75,206 YTD).
SUVs continue to shoot up at +15.6% year-on-year to 72,752 units and 66.9% share vs. 60.7% in August 2025 and 57.4% two years ago, light commercials drop -22.1% to 18,081 and 16.6% share vs. 22.4% last year and 22.3% in August 2024 and passenger cars post a rare gain at +7.4% to 14,930 and 13.7% share vs. 13.4% a year ago and 16.2% in 2024. Heavy commercials sink -17.4% to 2,997 and 2.8% share vs. 3.5% in 2025 and 4.1% two years ago. Excluding Tesla, Polestar and heavy commercials, private sales are up a very encouraging 7.7% to 52,916 whereas business fleets drop -5.8% to 36,426, rentals edge up 0.1% to 6,277 and government sales freefall -18.9% to 2,323.
The Tesla Model Y is the best-selling vehicle in Australia for the 2nd time ever.
Looking at sales by state and territory, Tasmania delivers the best performance at +9.3% to 1,698, followed by Western Australia at +8.7% to 11,572, South Australia at +4% to 6,660, Northern Territory at +2.5% to 861 and Victoria at +0.9% to 27,270. All others are in negative, with New South Wales down -0.1% to 30,517, Queensland -4.8% to 20,849 and the Australian Capital Territory at -6.4% to 1,512. As for country of origin, China is by far the most popular with sales surging 88.9% to 43,882 and 40.3% share. It ranked a distant #2 last year and is followed by Japan down -12.8% to 24,892, Thailand off -24.7% to 15,658, South Korea down -14.2% to 11,060 and Germany down -15.2% to 3,718.
In the brands ranking, Toyota (-5.2%) continues to struggle but at 18.1% share it is well above its paltry 15.9% from YTD. BYD (+68.8%) ranks #2 for the 5th consecutive month and improves to 7.6% share vs. 7.2% in July. It holds 8.1% of the market YTD. Tesla (+162.6%) surges to #3 with 7.1% share which are new record, previous best being #4 and 6.2% last June. Kia (-12.2%), Mazda (-9%) and Hyundai (-15.3%) all fall, but GWM (+8.5%) is up two spots on July to equal its ranking record at #7.
The Zeekr 7X repeats at #10.
Ford (-39.8%) endures a mediocre month at #8 with 4.4% share and falls to #4 year-to-date, overtaken by Kia. This is Ford’s worst ranking since we started to follow the Australian brands charts monthly in January 2011. Previous worst was #7 in February 2015, March 2015 and March 2020. Meanwhile MG (+22.2%) is up one rank to #9 and Geely (+1023.2%) cracks the Australian Top 10 for the first time at #10, also reaching all-time high share (4.1%), and volumes (4,504) for the 7th straight month. Chery (+28.2%) ends a surreal 18 months streak of record volumes and falls to #11. Omoda Jaecoo (+340.6%) is up to #14 while Zeekr (+2309.1%) breaks into the Top 15 for the first time at #15 with a record volume (2,120). All in all, Chinese brands are up 80.7% in August to 31.5% share vs. 18.3% a year ago. Hit full frontal by the Chinese competition, Mitsubishi (-42.6%) sinks to #13, its lowest ever ranking in Australia.
Model-wise, the Tesla Model Y (+176%) is up to #1 for the second time in the past three months (and ever), climbing to 5.9% share. The Toyota RAV4 (+32.9%) is knocked down to #2 and is stuck at a distant #4 year-to-date. Lukewarm performance for the Toyota Hilux (+0.2%) stable in a positive market despite its new generation. It outsells a freefalling Ford Ranger (-50.6%) for the second straight month. The Toyota Prado (+21.7%) is up four spots on July to #4, its best ranking since February 2025. The BYD Sealion 7 (+56.6%) posts another strong result at #6, the #1 Chinese model above the Chery Tiggo 4 (+13%). The Geely EX5 (+385.5%) is up one rank on last month to reach a record #8 followed by the GWM Haval Jolion (+21.1%) while the new Zeekr 7X repeats at a fantastic 10th place. The new Jaecoo J5 is up two spots to #13, the new Geely EX2, one of the cheapest BEV available, is an instant success: up to #20 for its second month in market, and the new Geely Starray is up four ranks to #21.
Complete models data will be uploaded to this article when made available to us.
Previous month: Australia July 2026: Toyota RAV4 #1, Geely EX5 and Zeekr 7X inside Top 10
One year ago: Australia August 2025: Four Chinese brands in the Top 10 for the first time
Full August 2026 Top 60 All brands and Top 25 models below.
Australia August 2026 – brands:
PosBrandAug-26%/25Jul2026%/25PosFY251Toyota 19,71218.1%– 5.2%1135,26215.9%– 17.3%112BYD8,2317.6%+ 68.8%268,4238.1%+ 108.4%283Tesla7,6857.1%+ 162.6%736,0514.2%+ 100.4%8154Kia 6,5006.0%– 12.2%354,8996.5%– 1.2%345Mazda 6,2035.7%– 9.0%453,1636.3%– 15.9%536Hyundai 5,3554.9%– 15.3%650,9366.0%– 2.0%657GWM4,8704.5%+ 8.5%939,7474.7%+ 15.6%778Ford 4,8164.4%– 39.8%553,5126.3%– 14.5%429MG4,7674.4%+ 22.2%1032,1973.8%+ 12.8%101010Geely4,5044.1%+ 1023.2%1119,1592.3%+ 600.3%132711Chery4,2383.9%+ 28.2%833,8174.0%+ 64.3%91312Isuzu Ute2,7902.6%– 13.4%1326,0973.1%– 10.3%12913Mitsubishi2,6122.4%– 42.6%1230,4763.6%– 29.0%11614Omoda Jaecoo2,2032.0%+ 340.6%1613,1461.5%+ 709.5%193215Zeekr2,1201.9%+ 2309.1%1710,0701.2%+ 1550.8%213616Subaru 2,0271.9%– 36.7%1419,1252.3%– 27.5%141117Nissan1,7391.6%– 33.4%1917,1842.0%– 33.6%151218Mercedes1,6741.5%– 24.3%1516,9692.0%– 8.2%161619Volkswagen1,6291.5%– 38.0%1815,5621.8%– 21.4%181420BMW1,5221.4%– 11.6%2015,6191.8%– 12.7%171721Lexus1,1631.1%– 0.4%238,5151.0%– 13.6%242122Honda 1,1001.0%– 7.2%2110,5701.2%+ 1.5%201923LDV1,1001.0%– 11.8%248,5471.0%– 11.9%232224GAC1,0661.0%new252,0740.2%new36 –25Suzuki 9330.9%+ 11.7%228,8051.0%– 16.0%222026Audi7130.7%– 49.7%267,6850.9%– 19.6%251827Volvo5820.5%– 9.2%284,7110.6%– 1.1%272428Land Rover5390.5%– 19.1%274,8720.6%– 15.6%262329Xpeng5110.5%new485680.1%new45 –30KGM4700.4%+ 53.1%292,5140.3%– 14.0%333031Mini4020.4%– 6.5%303,5550.4%– 5.4%282532Skoda3530.3%– 16.0%332,7510.3%– 5.2%312833Chevrolet2970.3%– 13.9%322,3710.3%– 8.8%343134Porsche2900.3%– 30.8%312,7040.3%– 29.3%322635Denza2610.2%new342,9540.3%new305736Renault2500.2%– 24.0%362,9590.3%– 7.5%292937Ram2370.2%– 8.8%352,0770.2%– 7.4%353338Foton1530.1%new381,0260.1%new405139Fiat1460.1%– 4.6%371,2180.1%– 2.1%393740Polestar1360.1%– 40.4%391,4790.2%– 9.3%373541Leapmotor1120.1%+ 286.2%401,0220.1%+ 168.2%414242Genesis1040.1%– 21.8%419860.1%– 4.5%423943Peugeot880.1%– 24.8%455630.1%– 41.4%464144JAC770.1%– 43.8%445710.1%– 50.2%444045Cupra740.1%– 60.6%421,2850.2%– 33.8%383446Farizon500.0%new462590.0%new48 –47Deepal450.0%+ 181.3%438610.1%+ 455.5%434548Jeep210.0%– 86.5%474010.0%– 71.2%473849Lamborghini210.0%+ 40.0%521070.0%– 42.5%544750Aston Martin190.0%+ 72.7%541180.0%– 0.8%535051GMC180.0%– 59.1%512370.0%+ 46.3%494652Bentley140.0%+ 16.7%55970.0%+ 21.3%555253Ferrari130.0%– 35.0%491260.0%– 10.6%514954Maserati100.0%– 54.5%531250.0%– 34.9%524855Alfa Romeo90.0%– 67.9%502240.0%– 34.3%504456Lotus30.0%– 62.5%56130.0%– 73.5%585357Rolls-Royce30.0%– 25.0%58350.0%– 22.2%565558McLaren10.0%– 83.3%57240.0%– 48.9%575459Citroen00.0%– 100.0% –30.0%– 62.5%605660Forthing00.0%new –20.0%new61 –
Australia August 2026 – models:
PosModelAug-26%/25Jul2026%/25PosFY251Tesla Model Y6,4145.9%+ 176.0%331,4543.7%+ 136.3%3102Toyota RAV45,4705.0%+ 32.9%126,5853.1%– 18.4%423Toyota Hilux4,8334.4%+ 0.2%232,1613.8%– 10.1%234Toyota Prado2,4752.3%+ 21.7%813,6591.6%– 31.6%1365Ford Ranger2,4402.2%– 50.6%432,7963.9%– 11.8%116BYD Sealion 72,2132.0%+ 56.6%517,2772.0%+ 161.9%6257Chery Tiggo 42,0121.8%+ 13.0%617,8062.1%+ 50.4%5118Geely EX51,9471.8%+ 385.5%910,7371.3%+ 292.4%19789GWM Haval Jolion1,8911.7%+ 21.1%1415,0331.8%+ 22.4%91410Zeekr 7X1,7481.6%new109,1721.1%new2114611Isuzu D-Max1,7081.6%– 26.2%1216,3711.9%– 12.6%8412Hyundai Kona1,6881.6%– 14.9%716,9162.0%+ 11.8%7713Jaecoo J51,6721.5%new159,4391.1%new20 –14Ford Everest1,6601.5%– 24.6%1314,4901.7%– 14.4%10515Kia Sportage1,5861.5%– 4.1%1612,7731.5%– 6.6%161516Hyundai Tucson1,5481.4%+ 15.5%1714,2721.7%+ 5.5%111217Mazda CX-51,4601.3%– 2.1%1113,8381.6%– 9.6%12818BYD Shark 61,3851.3%+ 9.8%2212,0941.4%– 6.4%171819MG ZS1,3571.2%– 49.4%1811,8221.4%– 18.0%181320Geely EX21,2791.2%new561,7530.2%new97 –21Geely Starray1,2781.2%new256,6690.8%new3715422Tesla Model 31,2711.2%+ 110.8%1374,5970.5%– 1.8%455123Mitsubishi Triton1,1611.1%– 23.8%2012,8311.5%+ 4.4%151724Toyota Land Cruiser Wagon1,1501.1%– 4.8%199,0001.1%+ 16.6%222825Mitsubishi Outlander1,1311.0%– 36.3%2113,3201.6%– 11.5%14926BYD Atto 21,1221.0%new237,7370.9%new2916827Kia Carnival1,1101.0%+ 23.5%367,9700.9%+ 9.0%2730
Source: FCAI, VFACTS


More Stories
When every kilometre counts, Suzuki puts fuel economy to the test
With fuel prices rising, Suzuki put its fuel-efficient range to the test. Discover how five Suzuki models performed on Pretoria’s...
Brilliant Design Features That Make the Alpine A310 VISION So Exciting
The A310 VISION also demonstrates the design opportunities offered by Alpine’s APP platform. Developed to support future sports cars, the...
Opel STX Concept Brings Active Aerodynamics to the Electric Estate Car
Opel is preparing a new concept car for the 2026 Paris Motor Show. Called the STX, it previews a future...
A Modern Citroën 2CV Sounds Great. Until You Think About the Price
Citroën has revived the 2CV name at the Paris Motor Show, displaying two concepts inspired by its most recognisable small...
Pickup Truck vs SUV Insurance Costs and What Drivers Should Know
Insurance belongs in the buying budget when the shortlist includes a pickup and an SUV. Either vehicle may cost less...
Porsche Mission S Could Get a Manual Transmission and That Makes This Mid-Engine Supercar Even More Exciting
Just when we thought Porsche’s stunning new Mission S concept couldn’t get any more exciting, the German automaker has revealed...