
Italy August 2026: Omoda/Jaecoo and BYD Seal U in Top 10 for the first time

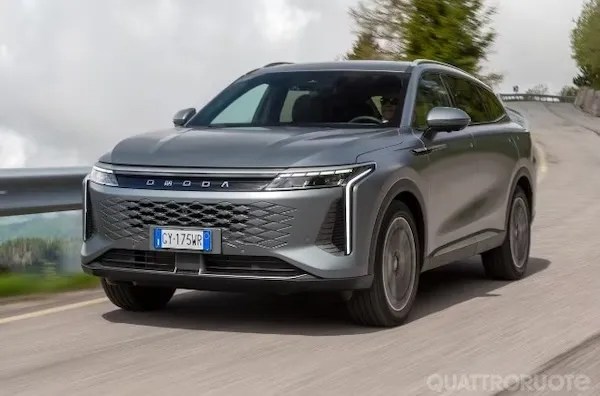
Omoda/Jaecoo is the #8 brand in Italy in August with 4.1% share.
New car sales in Italy gain 3.2% year-on-year in August to 69,411 units in what is traditionally the weakest month of the year, coinciding with the summer holidays. The year-to-date volume is now up 8.5% to 1,129,596 which is however -14.8% below the pre-pandemic figure of 8 months 2019. Private sales gain 2.6% year-on-year to 38,294 and 54.5% share vs. 55.1% a year ago (+10.8% to 53.4% YTD), self registrations drop -5% to 11,170 and 15.9% share vs. 17.3% last year (+5.3% to 10.9% share YTD, long term leases advance 8.3% to 14,660 and 20.9% share vs. 20% in August 2025 (-2.4% to 21% share YTD), short term rentals surge 62.7% to 2,540 and 3.6% share vs. 2.3% (+41.5% to 9.5% share YTD) and company sales are up 1.1% to 3,640 and 5.2% share vs. 5.3% last year (+0.9% to 5.7% share YTD).
The 15 years old Fiat Panda is still the best-selling vehicle in Italy, by far.
HEV sales are up 7.5% to 32,969 and 46.9% share vs. 45.2% a year ago, including 11,779 full hybrids (+25.5%) and 21,190 mild hybrids (-0.5%). PHEVs soar 74.3% to 8,446 and 12% share vs. 7.1% last year and BEVs gain 35.7% to 4,486 and 6.4% share vs. 4.9% in August 2025 and 5.9% last month. This means rechargeable vehicles see their sales grow 58.6% to 12,932 and 18.4% share vs. 12% a year ago and 16.4% in July. Year-to-date, BEVs advance 69.2% to 91,475 units and 8% share vs. 5.2% over the same period in 2025.
The BYD Seal U is up to #7 in Italy this month.
In the brands ranking, local behemoth Fiat (+22.3%) continues to rally back and scores a still very modest 11% share at home. Volkswagen (+8.8%) is up two spots on July to land in 2nd place, leapfrogging past Toyota (-16.5%) and Dacia (-14.8%). Renault (+9%) is solid and repeats at #5 ahead of BMW (-9.5%) and Audi (-3.5%) both struggling. The event of the month is the 8th place of Chinese carmaker Omoda+Jaecoo (+209.7%) tripling its year-ago volume. This is the first time the co-brands finish inside the Top 10, with a previous best of #13 reached just last month. It’s also a record share at 4.1%. BYD (+194.4%) is also in outstanding shape but slides outside the Top 10 at #11. Kia (+16%) and MG (+13.4%) also impress.
The Lancia Gamma makes its first appearance in the Italian charts.
Over in the models charts, the Fiat Panda (+13.6%) dominates again with 6.7% share, distancing a suffering Dacia Sandero (-11.6%) and a surging Citroen C3 (+59.2%). The Jeep Avenger (-34%) craters year-on-year but gains four spots on July to #4, managing to maintain itself in 2nd place year-to-date above the Sandero. The Fiat Grande Panda (+41.9%) drops one rank to #5, confirming its lukewarm performance at just 2.2% share. Up to #3 last month, the Renault Clio (+38.7%) once again performs way above its year-ago level but falls to #6. Meanwhile the BYD Seal U (+171.4%) surges 20 spots on last month to break into the Top 10 for the first time at #7 and 2.1% share (previous best #17 and 1.5% share). Illustrating the co-brands performance, the Omoda 5 (+221.4%) soars to a record #15 while the Jaecoo 7 (+37.4%) is up to #32, the Omoda 9 sells 317 units and the Jaecoo 8 180. Notice also the Lancia Gamma selling its first 14 units and ranking #9 in its segment.
Previous month: Italy July 2026: Omoda/Jaecoo breaks records, Renault Clio up to #3
One year ago: Italy August 2025: Fiat Grande Panda gears up, Kia Sportage cracks Top 10
Full August 2026 Top 58 All brands and Top 50 models below.
Italy August 2026 – brands:
PosBrandAug-26%/25Jul2026%/25PosFY251Fiat7,66111.0%+ 22.3%1128,50611.4%+ 28.8%112Volkswagen5,1767.5%+ 8.9%476,7936.8%+ 2.1%333Toyota4,7416.8%– 16.5%278,8787.0%– 1.8%224Dacia3,8035.5%– 14.8%361,5645.5%– 9.2%445Renault3,2334.7%+ 9.0%554,0774.8%+ 4.2%566BMW3,1694.6%– 9.5%749,0564.3%– 0.4%877Audi3,1374.5%– 3.5%652,3444.6%+ 13.2%788Omoda+Jaecoo2,8624.1%+ 209.7%1327,5552.4%+ 261.9%17259Peugeot2,8334.1%– 3.2%953,0664.7%– 6.5%6510Kia2,7774.0%+ 16.0%1133,9923.0%+ 14.5%151511BYD2,5793.7%+ 194.4%1036,5493.2%+ 194.7%132112MG2,5613.7%+ 13.4%1537,4123.3%+ 6.0%111313Citroen2,4513.5%+ 9.1%1240,1273.6%+ 1.8%101114Jeep2,1363.1%– 25.9%1640,6443.6%– 9.1%9915Ford2,0873.0%– 26.9%1435,0083.1%– 23.3%141016Skoda1,9022.7%– 18.9%1726,2562.3%+ 4.0%181617Mercedes1,8692.7%– 2.5%836,9923.3%+ 3.7%121218Opel1,6112.3%– 1.5%2027,8742.5%+ 5.7%161719Hyundai1,3672.0%– 48.9%1922,5502.0%– 29.1%211420Cupra1,1661.7%+ 13.3%2315,0041.3%+ 6.6%232221Suzuki1,1571.7%+ 17.0%1820,5761.8%– 4.1%221922Nissan9991.4%+ 1.4%2122,7532.0%– 1.4%201823DR Motor9061.3%+ 14.4%229,2390.8%– 19.6%272324Leapmotor8511.2%+ 254.6%2626,2492.3%+ 1105.2%193225Alfa Romeo8211.2%– 16.1%2514,9511.3%– 24.5%242026Mini7421.1%– 2.1%2411,9391.1%+ 22.6%252427Honda5710.8%+ 41.3%288,3760.7%+ 40.1%292928Mazda5370.8%+ 22.9%298,4970.8%+ 22.5%282829Volvo4400.6%– 2.9%279,3190.8%+ 1.1%262630Lancia4130.6%– 7.4%316,2880.6%– 4.9%313031Lexus3040.4%+ 24.1%324,4400.4%+ 4.9%343632Tesla2670.4%– 35.8%478,2900.7%+ 12.9%302733EMC2570.4%+ 74.8%353,8870.3%+ 115.1%373834Seat2530.4%– 38.1%335,4740.5%– 3.5%323135Porsche2390.3%+ 0.8%304,0280.4%– 10.6%363336Land Rover2140.3%– 26.2%344,3980.4%– 14.2%353437EVO1360.2%– 41.6%364,8760.4%+ 20.0%333538Lynk & Co1290.2%+ 344.8%421,3010.1%+ 338.0%444539Geely1180.2%+ 742.9%373,1790.3%+ 22607.1%38n/a40KGM1040.1%+ 10300.0%401,5020.1%+ 510.6%435041Subaru1020.1%+ 27.5%391,7830.2%+ 5.1%413942Deepal720.1%new484260.0%new53 –43DFSK630.1%– 32.3%382,1170.2%+ 181.1%404344Mitsubishi560.1%– 5.1%445230.0%– 56.5%504245DS510.1%– 67.9%412,4600.2%– 27.9%393746Ich-X500.1%+ 316.7%431,0140.1%+ 624.3%45n/a47Sportequipe460.1%– 66.2%461,5460.1%+ 14.4%424048Maserati440.1%– 57.3%507480.1%– 42.7%464149SWM380.1%+ 5.6%527340.1%+ 74.8%47n/a50Ferrari270.0%+ 3.8%457260.1%+ 26.5%484451Alpine200.0%+ 17.6%543020.0%+ 45.9%54n/a52Lamborghini200.0%+ 0.0%495110.0%+ 26.8%514853Polestar190.0%– 5.0%554320.0%+ 48.5%524954Smart190.0%+ 72.7%512880.0%– 50.2%554655Tiger180.0%+ 12.5%535720.1%+ 17.4%49n/a56Aston Martin60.0%+ 20.0%56930.0%+ 19.2%575357Lotus50.0%– 37.5%571120.0%– 36.0%565158Jaguar00.0%n/a –70.0%– 96.2%585259Mahindra00.0%– 100.0% –10.0%– 99.8%5947 –Others1760.3%+ 300.0% –1,3920.1%+ 10.7% – –
Italy August 2026 – models:
PosModelAug-26%/25Jul2026%/25PosFY251Fiat Panda4,6856.7%+ 13.6%175,9986.7%+ 2.3%112Dacia Sandero2,1583.1%– 11.6%229,1062.6%– 15.6%323Citroen C31,7022.5%+ 59.2%525,3962.2%– 11.0%544Jeep Avenger1,5662.3%– 34.0%831,9382.8%– 4.4%235Fiat Grande Panda1,5612.2%+ 41.9%427,5582.4%+ 623.3%4376Renault Clio1,5462.2%+ 38.7%321,9791.9%+ 11.3%897BYD Seal U1,4902.1%+ 171.4%2710,3200.9%+ 13.0%32268MG ZS1,3161.9%– 3.1%1419,6621.7%– 5.3%11109Peugeot 2081,2971.9%+ 21.0%1221,1831.9%– 13.8%10810Kia Sportage1,2761.8%+ 10.8%1315,9441.4%+ 20.1%182011Dacia Duster1,2251.8%– 25.0%719,2801.7%– 25.0%13712Toyota Yaris Cross1,2101.7%– 28.7%622,6392.0%– 4.8%6513VW T-Roc1,1951.7%– 12.1%1118,6751.7%+ 7.4%151114Toyota Aygo X1,1821.7%+ 16.8%1021,6861.9%+ 44.6%91415Omoda 51,0801.6%+ 221.4%2610,7731.0%+ 240.8%30n/a16Renault Captur1,0551.5%– 7.4%1618,7631.7%+ 8.8%141317VW T-Cross1,0031.4%– 3.0%2116,2941.4%+ 8.0%171718Ford Puma9991.4%– 25.6%1816,3181.4%– 12.0%161219Opel Corsa9871.4%+ 13.2%2215,4541.4%– 3.5%201820Toyota Yaris9401.4%– 41.0%919,5921.7%– 16.1%12621BMW X18981.3%– 2.4%2314,7251.3%+ 0.0%231622Audi Q38571.2%+ 98.4%1515,3911.4%+ 98.9%214023VW Tiguan8501.2%– 25.6%1915,3801.4%– 3.7%221524Toyota C-HR8271.2%+ 6.7%2910,5230.9%– 4.2%312425MG 38051.2%+ 48.3%4311,0721.0%+ 13.6%283126Kia Picanto7581.1%+ 7.4%329,7930.9%+ 5.5%343027Audi A37401.1%+ 11.3%368,4560.7%– 19.1%392528Fiat 5007351.1%+ 2196.9%2511,3651.0%+ 851.0%27n/a29VW Polo6831.0%+ 220.7%37n/an/an/an/an/a30Peugeot 20086781.0%– 1.2%2812,4181.1%– 10.8%262131VW Golf6530.9%+ 40.1%309,6540.9%+ 1.9%352932Jaecoo 76140.9%+ 37.4%386,5780.6%n/a49n/a33Peugeot 30086080.9%– 25.8%3912,4291.1%+ 12.1%252334DR 55990.9%+ 89.0%442,6300.2%– 57.2%n/a4935Skoda Fabia5770.8%– 33.4%n/a7,4370.7%– 1.5%423636Audi Q55680.8%+ 13.8%476,8240.6%+ 42.6%47n/a37Jeep Compass5610.8%+ 95.5%338,4300.7%+ 41.4%40n/a38Mercedes GLA5520.8%+ 15.0%179,0890.8%+ 8.4%373339Alfa Romeo Junior5500.8%– 15.6%487,8390.7%– 22.3%412840Suzuki Swift5210.8%+ 35.0%249,8750.9%+ 36.7%333541Kia Stonic5030.7%n/a35n/an/an/an/an/a42Nissan Qashqai5000.7%+ 1.0%4213,2021.2%+ 7.0%242243Fiat 6004970.7%– 31.4%3110,9331.0%– 31.7%291944Hyundai i204940.7%+ 6.0%n/a6,5190.6%n/a50n/a45BYD Atto 24870.7%new2015,4801.4%new19n/a46Leapmotor B104700.7%newn/an/an/anewn/a –47Skoda Kamiq4620.7%– 40.9%n/a6,6230.6%– 9.3%483848BMW X34520.7%– 26.9%417,0710.6%+ 17.7%454749Mini Hatch4310.6%n/an/an/an/an/an/an/a50BMW Serie 14270.6%– 20.6%n/an/an/an/an/a45n/aSuzuki Vitara4200.6%+ 19.0%467,0190.6%+ 1.1%4641n/aCitroen C3 Aircross4180.6%n/an/a8,5350.8%n/a38n/an/aFord Kuga4180.6%+ 2.0%407,1780.6%– 4.4%4443n/aNissan Juke4090.6%+ 3.8%497,3110.6%– 12.3%4334n/aHyundai Tucson3910.6%– 41.6%349,1650.8%+ 4.1%3632n/aLeapmotor T031870.3%+ 16.1%n/a22,5452.0%+ 1234.0%7n/a
Source: UNRAE

More Stories
When every kilometre counts, Suzuki puts fuel economy to the test
With fuel prices rising, Suzuki put its fuel-efficient range to the test. Discover how five Suzuki models performed on Pretoria’s...
Brilliant Design Features That Make the Alpine A310 VISION So Exciting
The A310 VISION also demonstrates the design opportunities offered by Alpine’s APP platform. Developed to support future sports cars, the...
Opel STX Concept Brings Active Aerodynamics to the Electric Estate Car
Opel is preparing a new concept car for the 2026 Paris Motor Show. Called the STX, it previews a future...
A Modern Citroën 2CV Sounds Great. Until You Think About the Price
Citroën has revived the 2CV name at the Paris Motor Show, displaying two concepts inspired by its most recognisable small...
Pickup Truck vs SUV Insurance Costs and What Drivers Should Know
Insurance belongs in the buying budget when the shortlist includes a pickup and an SUV. Either vehicle may cost less...
Porsche Mission S Could Get a Manual Transmission and That Makes This Mid-Engine Supercar Even More Exciting
Just when we thought Porsche’s stunning new Mission S concept couldn’t get any more exciting, the German automaker has revealed...