
USA July 2026: Sales down -1.4%, Honda (+12.3%), Acura (+18.9%) stand out

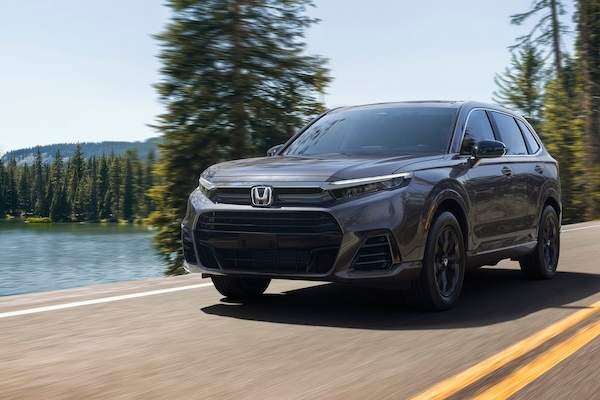
The Honda CR-V remains well above its archenemy the Toyota RAV4.
The U.S. new light vehicle market falls slightly in July at -1.4% year-on-year to 1.38 million units according to preliminary figures by GlobalData. Sales are hampered by a relatively strong year-ago result when customers rushed to dealerships to purchase EVs before the expiry of federal incentives. However strong hybrid sales in a high fuel prices context levelled the field somewhat. Year-to-date sales are estimated to drop -2.7% by GlobalData.
The July SAAR stands at 16.51 million according to Motor Intelligence, down from 16.67 million in June and 16.72 million in July 2025. July marks the fifth month in a row of SAAR above 16 million, a feat that hadn’t happened in over 5 years. Average incentives reached 6.7% percent of the suggested retail price, up from 6.3% in July 2025 according to JD Power and GlobalData. The average transaction price continues to climb at +1.2% to $45,369 units. The BEV market share is at 7% vs. 10.9% in July 2025. In contrast hybrid share is expected to rise 2.5 percentage points year-on-year to 15.9%, still according to JD Power and GlobalData.
Among OEMs still reporting monthly data, American Honda (+12.8%) fares best with a splendid double-digit gains, with Hyundai-Kia (+5%) also defying the market’s slump. Toyota Motor (-0.8%) is stable but Ford Motor (-10.3%) struggles and has now registered year-on-year losses for each month this year. This is the same situation for the Ford brand (-9.2%). Toyota (-0.3%) still leads the brands charts with Honda (+12.3%) impressive. Honda hybrid sales are up 15% to almost 30% share, with the Accord hybrid up 29% and the CR-V hybrid up 18%. Hyundai (+3.7%) and Kia (+6.7%) both post July records and both in positive for the third month in a row. Hybrid Hyundai sales are up 35% while Kia hybrids surge 108%. Acura (+18.9%) delivers a fantastic month while Genesis (+3.9%) is up year-on-year for a staggering 22nd straight month.
Looking at models with available monthly sales data, the Ford F-Series (-6.5%) is down once again, still impacted from the Novelis aluminium plant disruption following a fire. Strikingly the Honda CR-V (+18.8%) surges ahead, leaving the Toyota RAV4 (-21.3%) in the dust and increases its year-to-date advantage to a seemingly unsurmountable 79,209 sales. Illustrating the new trend towards more efficient cars, the Toyota Camry is up 17.2%, Honda Civic up 20.7%, Toyota Corolla up 12.9%. Honda Accord up 54.7% and Hyundai Elantra up 38.5%. As for crossovers, the Subaru Forester (+33.5%), Hyundai Tucson (+20.2%) and Kia Seltos (+79.1%) stand out. Notice also the Ford Maverick up 29.1%.
Previous post: USA H1 2026: Ram Pickup, Toyota Camry impress, Honda CR-V “real” #1, market off -2.7%
Previous month: USA June/Q2 2026: Hybrids spur market up 7.9%, Nissan and Stellantis recover
One year ago: USA July 2026: Toyota (+21.9%) pushed up by 4Runner (+91.2%), Tacoma (+42.3%)
Full July 2026 data for selected OEMs, brands and models below.
USA July 2026 – OEMs still reporting monthly data:
OEMJul-26/251-7 2026/25Toyota Motor216,361– 0.8%1,459,751+ 0.3%Ford Motor Co168,920– 10.3%1,169,882– 9.7%Hyundai-Kia165,284+ 5.0%1,085,667+ 3.3%American Honda136,549+ 12.8%893,469+ 3.9%Subaru54,454+ 0.8%361,794– 3.7%Mazda39,180– 13.0%241,014– 5.6%
USA July 2026 – brands still reporting monthly data:
BrandJul-26/251-7 2026/25Toyota185,960– 0.3%1,259,638+ 1.2%Ford163,820– 9.2%1,114,783– 9.6%Honda124,553+ 12.3%811,758+ 3.8%Hyundai82,480+ 3.7%533,048+ 2.7%Kia75,857+ 6.7%506,584+ 3.9%Subaru54,454+ 0.8%361,794– 3.7%Mazda39,180– 13.0%241,014– 5.6%Lexus30,401– 3.3%200,113– 4.9%Acura11,996+ 18.9%81,710+ 4.1%Genesis6,947+ 3.9%46,035+ 4.5%Lincoln5,100– 35.9%55,099– 12.6%
USA July 2026 – models with available monthly data:
ModelJul-26/251-7 2026/25Ford F-Series68,755– 6.5%426,556– 12.3%Honda CR-V38,335+ 18.8%264,449+ 8.0%Toyota RAV431,285– 21.3%185,240– 33.7%Toyota Camry30,536+ 17.2%209,580+ 15.5%Toyota Tacoma25,148– 4.8%168,996+ 7.4%Honda Civic22,995+ 20.7%155,435+ 5.5%Toyota Corolla22,601+ 12.9%154,004+ 9.9%Honda Accord 20,255+ 54.7%110,323+ 36.1%Hyundai Tucson19,714+ 20.2%137,326+ 5.9%Ford Explorer18,904+ 0.4%145,829+ 17.8%Hyundai Elantra17,115+ 38.5%96,954+ 11.3%Kia Sportage16,083+ 11.7%110,990+ 9.3%Subaru Forester15,873+ 33.5%123,727+ 14.7%Subaru Crosstrek15,789– 10.4%103,412– 4.2%Ford Maverick15,522+ 29.1%97,233– 0.9%Subaru Outback13,917– 7.1%76,875– 12.9%Honda HR-V13,539+ 15.6%81,913– 9.8%Hyundai Santa Fe13,373– 5.3%77,376– 2.3%Toyota 4Runner13,357– 8.4%85,677+ 91.5%Ford Bronco13,075– 5.2%90,011+ 4.8%Ford Transit12,943– 3.8%91,868+ 2.6%Hyundai Palisade12,173– 8.0%75,626+ 7.4%Ford Bronco Sport12,095+ 10.6%83,582+ 0.2%Kia K412,094+ 8.1%85,673– 1.2%Mazda CX-512,068– 22.3%74,760– 12.9%Toyota Tundra11,958– 11.7%86,326– 2.5%Kia Telluride11,816+ 13.5%85,418+ 18.8%Mazda CX-5011,691– 15.3%76,510+ 26.0%Toyota Grand Highlander11,405+ 5.1%86,926+ 14.0%Lexus RX10,294+ 14.4%70,198+ 13.4%Honda Pilot10,125+ 2.2%73,508– 2.1%Toyota Corolla Cross10,074+ 16.6%71,615+ 19.4%Toyota Sienna9,607+ 28.7%64,859+ 7.7%Kia Sorento9,038+ 13.5%58,386– 0.8%Kia Seltos8,807+ 79.1%41,311+ 38.4%Kia Carnival7,279+ 22.8%47,347+ 21.2%Honda Odyssey7,183– 18.6%50,029– 15.0%Kia K56,694+ 13.9%45,088+ 11.5%Lexus NX6,459– 5.6%37,222– 17.5%Hyundai Kona6,040– 4.0%42,209– 8.5%Ford Ranger5,823– 2.5%39,892+ 2.4%Ford Expedition5,797– 22.9%46,208– 11.6%Honda Passport5,641+ 18.5%36,001+ 13.1%Hyundai Sonata5,218+ 18.2%42,275+ 13.0%Lexus TX5,081+ 6.9%33,193+ 11.0%Mazda CX-904,831– 28.3%26,102– 25.0%Acura MDX4,786+ 60.8%28,887+ 15.9%Honda Ridgeline4,572– 8.5%28,062– 4.2%Mazda CX-304,526+ 9.7%26,142– 33.2%Subaru Ascent4,152+ 38.1%23,770– 2.9%Mazda33,903+ 87.5%24,355+ 28.0%Hyundai Ioniq 53,636– 37.5%24,366– 2.2%Toyota Highlander3,594– 19.6%35,653+ 3.3%Ford Mustang3,406– 19.5%32,131+ 15.7%Toyota Prius3,139– 23.8%22,657– 40.3%Toyota Land Cruiser3,118+ 17.3%19,530– 34.9%Ford E-Series3,013– 15.7%21,242– 7.8%Genesis GV702,985+ 3.9%20,584+ 8.1%Lexus IS2,959+ 94.8%17,030+ 49.7%Acura ADX2,941+ 28.3%19,495+ 180.4%Hyundai Venue2,879+ 12.2%18,504+ 2.6%Lexus GX2,819– 17.5%17,800– 20.2%Toyota BZ/bZ4X2,674+ 38.3%20,781+ 85.8%Ford Escape2,624– 76.6%26,736– 71.5%Toyota Sequoia2,562+ 12.5%16,501+ 13.8%Genesis GV802,372+ 9.6%15,536+ 7.4%Acura Integra2,370+ 68.8%16,457+ 45.3%Toyota Crown Signia2,203+ 63.4%13,434– 1.4%Acura RDX1,891– 4.2%15,667– 21.1%Lincoln Nautilus1,868– 31.8%20,050– 5.7%Ford Mustang Mach-E1,863– 64.9%13,495– 50.2%Kia Niro1,722– 37.4%15,489+ 6.5%Lincoln Navigator1,655– 2.5%12,049– 8.1%Kia EV91,650– 5.0%8,685+ 30.1%Hyundai Santa Cruz1,556– 32.7%11,537– 30.2%Honda Prologue1,554– 75.4%9,961– 56.0%Subaru Impreza1,458– 38.6%9,840– 43.3%Subaru WRX1,438+ 214.7%8,546+ 24.1%Lincoln Aviator1,430– 2.7%14,852+ 10.1%Toyota C-HR1,189new4,937newMazda CX-701,187– 25.8%7,161– 28.1%Subaru Trailseeker1,077new3,513newGenesis G701,073– 4.2%6,653+ 6.3%Mazda MX-5 Miata974– 16.3%5,984+ 0.8%Lexus RZ875+ 9.4%8,689+ 89.8%Hyundai Ioniq 9700– 34.8%5,558+ 166.4%Lexus LX697+ 20.0%4,414+ 3.6%Kia EV6674– 47.8%4,717– 34.2%Lexus UX664– 14.5%6,046+ 4.6%Toyota GR86663– 36.3%4,670– 27.8%Toyota Crown580– 46.8%5,732– 6.7%Lexus ES377– 89.2%4,273– 81.2%Subaru Uncharted359new2,850newHonda Prelude354new2,077newGenesis G80269– 4.3%1,911– 10.7%Toyota Supra242– 1.6%2,358+ 59.6%Subaru BRZ233+ 5.0%1,785– 5.4%Lexus LC175+ 124.4%864– 0.5%Lincoln Corsair147– 92.8%8,148– 46.2%Subaru Solterra138– 91.2%5,275– 34.6%Genesis G90135– 11.2%753– 12.3%Genesis GV60113+ 16.5%598– 53.6%Hyundai Ioniq 676– 92.0%1,317– 81.9%Toyota Mirai23– 28.1%152+ 94.9%Subaru Legacy20– 99.0%2,201– 83.2%Acura TLX8– 99.0%1,096– 75.2%Toyota Venza2– 50.0%8– 98.9%Lexus RC1– 98.9%238– 73.5%
Source: Manufacturers

More Stories
A Simple Pre-Winter Check for Your Tires and Battery
The first cold morning of the season has a way of finding the weak spots in a car. A tire...
Porsche Mission S Hypercar Teased with 8,000-RPM Redline Ahead of October 15 Reveal
Porsche is preparing to make a serious statement in the world of high-performance automobiles, and its upcoming Mission S hypercar...
Chinese Automaker Geely Coming to Canada in 2027 as New Import Rules Open the Door to Affordable EVs
The North American automotive landscape could be in for a significant shakeup as Chinese automotive giant Geely Auto has officially...
Rivian Goes Ghostbusters for Halloween with Ecto-1 Inspired EVs and Spooky Software Update
Rivian is getting into the Halloween spirit in a big way this year, and fans of the iconic Ghostbusters movies...
Keeping the Ram You Love, Updating the Part You Use Every Day
A favorite vehicle earns its place through use. There are the trips you planned for months, the quick runs for...
Is Your Car Ready for Colorado’s Traction Law?
A clear forecast in Denver can turn into a whiteout at the Eisenhower Tunnel. When that happens, the Colorado Department...