
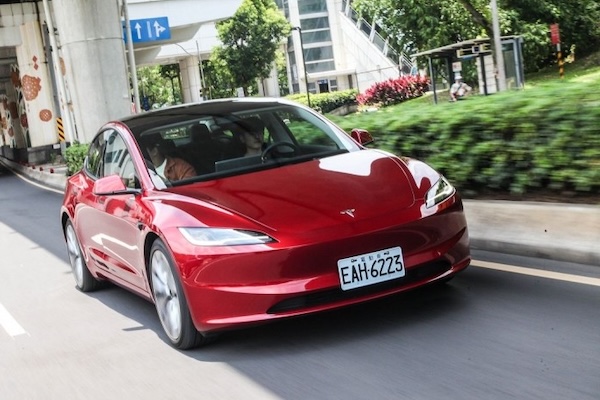
Taiwan June 2026: Tesla Model 3 at highest in 4 years
The Tesla Model 3 is up to 4th place in Taiwan in June.
New car sales in Taiwan rally back up 20.5% year-on-year in June to 41,361, leading to a year-to-date volume now in positive at +1.7% to 202,278. Toyota (+29.7%) continues to impress at 30.5% share but the best performer in the Top 10 is Tesla up 158.1% YoY to 10.6% share. Kia (+87.7%), Mazda (+53.1%), Lexus (+52.9%) and Honda (+42.6%) also post very strong results while Ford (+27.1%) and Mitsubishi (+21.8%) are closer to the market growth rate.
Model-wise, the Toyota Corolla Cross (+20%) matches the market at 11% share, distancing the Toyota RAV4 (+120.3%) and Tesla Model Y (+62.2%) like last month. The Tesla Model 3 (+392.7%) surges to 4th place with 1,611 sales and 3.9% share, the nameplate’s best result since August 2022 (#2 with 1,774 sales and 5.2% share). The Toyota Yaris Cross (+36.5%) also shine at #4 while the new Ford Territory lodges a 6th consecutive Top 10 finish at #7. The Kia Sportage (+243.7%), Lexus NX (+87.7%), Honda CR-V (+61.1%) and Mazda CX-5 (+58.4%) also impress below.
Previous month: Taiwan May 2026: Toyota Corolla Cross, RAV4 and Tesla Model Y dominate
One year ago: Taiwan June 2025: Peugeot 408 spectacularly storms into Top 10
Full June 2026 Top 10 brands and Top 70 models below.
Taiwan June 2026 – brands:
PosBrandJun-26%/25May2026%/24PosFY251Toyota12,61530.5%+ 29.7%162,31230.8%+ 1.9%112Tesla4,36910.6%+ 158.1%311,5895.7%+ 147.2%483Lexus2,6466.4%+ 52.9%214,2167.0%– 7.8%224Honda2,3825.8%+ 42.6%911,7095.8%+ 22.1%345CMC1,9124.6%– 10.5%410,9795.4%– 16.5%536Mercedes1,8124.4%– 1.5%59,6414.8%– 25.7%657Mazda1,6464.0%+ 53.1%67,4933.7%+ 24.1%1098BMW1,6323.9%+ 1.4%77,0153.5%– 21.6%1179Kia1,5153.7%+ 87.7%n/a5,0572.5%– 6.0%n/an/a10Mitsubishi1,4693.6%+ 21.8%88,2834.1%+ 25.9%810n/aFord1,4153.4%+ 27.1%n/a8,3624.1%+ 33.1%7n/an/aHyundai1,3643.3%– 25.5%108,1514.0%– 12.6%96
Taiwan June 2026 – models:
PosModelJun-26%/25May2026%/24PosFY251Toyota Corolla Cross4,55111.0%+ 20.0%122,65111.2%+ 10.3%112Toyota RAV42,9437.1%+ 120.3%212,4826.2%+ 24.5%223Tesla Model Y2,2015.3%+ 62.2%38,5214.2%+ 183.7%364Tesla Model 31,6113.9%+ 392.7%n/a2,2881.1%+ 60.7%19365Toyota Yaris Cross1,5553.8%+ 36.5%56,7283.3%– 11.6%656CMC J Space1,4573.5%– 5.7%47,9904.0%– 15.0%437Ford Territory1,2763.1%new96,8553.4%new5638Lexus NX1,2563.0%+ 87.7%66,5593.2%+ 10.1%779Toyota Town Ace1,1542.8%– 17.6%76,0493.0%– 28.8%8410Honda CR-V1,0892.6%+ 61.1%n/a3,6891.8%– 16.6%111011Kia Sportage9522.3%+ 243.7%212,0371.0%+ 29.9%222712Honda HR-V8892.1%+ 36.6%85,4282.7%+ 113.8%9913Mazda CX-58082.0%+ 58.4%103,2931.6%+ 58.6%121314Toyota Corolla Altis7041.7%– 0.3%113,8791.9%– 13.3%10815Lexus RX5931.4%+ 16.0%123,1901.6%+ 1.8%131416Mercedes GLC Class5531.3%+ 9.1%182,4991.2%– 40.8%181217Mitsubishi Xforce4991.2%new142,9581.5%new15n/a18Mitsubishi Delica4931.2%– 21.7%133,0081.5%– 13.1%141119Nissan Kicks4811.2%– 16.3%152,6121.3%+ 6.2%161720Hyundai Porter4721.1%+ 18.0%192,1521.1%+ 6.8%202321Toyota Camry4601.1%+ 187.5%162,5711.3%+ 41.8%172522Tesla Model X4431.1%n/an/a6030.3%+ 219.0%54 n/a23CMC Zinger4401.1%– 10.4%n/a1,9100.9%– 38.6%241524Lexus UX3900.9%+ 51.8%331,6590.8%– 28.9%261825Nissan X-Trail3530.9%– 16.5%351,4920.7%– 15.7%342426Mercedes GLE Class3210.8%+ 78.3%23n/an/an/an/a5527BMW X33120.8%– 31.9%261,4950.7%n/a33n/a28Toyota bZ4X3100.7%n/a462,0981.0%n/a21n/a29Nissan Sentra3040.7%+ 35.1%241,5800.8%+ 1.9%283230Mazda32830.7%+ 67.5%511,1690.6%– 17.6%373331Foxtron Bria2630.6%new291,6510.8%new27 –32Toyota Vios2620.6%– 10.0%301,7670.9%– 19.1%252233Honda Fit2460.6%+ 4.7%271,9361.0%– 10.8%232134Hyundai Custin2220.5%– 3.1%321,5290.8%– 7.8%293035Hyundai Tucson2180.5%– 46.2%441,1650.6%– 52.4%381936Mazda CX-302150.5%+ 1.9%201,5170.7%+ 19.6%313537Mercedes GLA Class2090.5%+ 54.8%54n/an/an/an/a3838Hyundai Venue2070.5%– 20.1%251,5110.7%– 3.4%323139Fuso Canter2020.5%+ 23.2%408950.4%– 23.3%453940Suzuki Swift1950.5%– 25.9%281,5240.8%+ 2.8%302841MG G50 Plus1810.4%new381,3250.7%new35n/a42Volvo XC601740.4%n/an/an/an/an/a58n/a43BMW 2 Series1730.4%+ 17.7%426710.3%– 12.1%495244Mercedes E Class1680.4%– 6.7%341,0390.5%– 15.3%404145MG ZS1670.4%+ 60.6%479150.5%+ 68.2%444746MG HS1640.4%– 41.8%369780.5%– 38.5%413447Lexus ES1630.4%+ 59.8%179370.5%– 1.7%424448Toyota Sienna1600.4%+ 58.4%37n/an/an/an/an/a49BMW X11530.4%n/a52n/an/an/an/an/a50Kia Stonic1520.4%n/a22n/an/an/an/an/a51BMW iX1480.4%n/a48n/an/an/an/an/a52Hyundai Mufasa1380.3%– 62.8%391,0390.5%+ 64.4%394053VW Golf1380.3%+ 9.5%536150.3%#VALUE!53n/a54VW Tiguan1260.3%– 48.6%417660.4%#VALUE!46n/a55Mitsubishi Outlander1210.3%– 25.8%n/a4500.2%#VALUE!65n/a56Skoda Kamiq1210.3%+ 33.0%n/a00.0%– 100.0%n/a6757BMW 3 Series1190.3%+ 56.6%66n/an/an/an/a6058Toyota Granvia+Hiace1180.3%+ 13.5%n/a3930.2%– 37.0%69n/a59BMW 1 Series1170.3%+ 4.5%645830.3%– 28.4%565060Volvo XC401160.3%– 17.1%63n/an/an/an/an/a61Tesla Model S1140.3%n/an/a1640.1%+ 331.6%n/an/a62Volvo EX301140.3%n/a695200.3%n/a60n/a63Mazda CX-601100.3%n/a56n/an/an/an/a5464Mitsubishi Colt Plus1100.3%– 41.8%596830.3%– 38.1%484365Skoda Octavia1040.3%– 31.1%686620.3%– 24.1%504566VW T-Cross970.2%n/a55n/an/an/an/an/a67Audi A3930.2%– 19.1%n/an/an/an/an/a6968Suzuki Carry890.2%+ 8.5%57n/an/an/an/an/a69Kia Picanto880.2%– 30.7%675790.3%n/a57n/a70Honda Civic830.2%– 17.8%585590.3%+ 32.2%5962
Source: u-car.com.tw

More Stories
Spain June 2026: BYD Atto 2 breaks into Top 10
The BYD Atto 2 is up to #9 in Spain in June. The Spanish new car market is up a...
Iceland June 2026: Tesla Model Y distant leader, Leapmotor C10 and Hongqi E-HS5 break records
The Leapmotor C10 is up to a record #13 in Iceland in June. New car sales in Iceland are hit...
2027 Chevy Corvette Stingray Brings 200-MPH Performance for Under $75,000
The Chevrolet Corvette has always been America’s performance bargain, but the 2027 Corvette Stingray just raised that argument to a...
Fiat Topolino Lands in America as Adorable Multiplina Concept Teases a Bigger Microcar Future
Fiat appears ready to bring a little more Italian charm to American streets, and this time it is arriving in...
The Real Price of Selling Your Car the Old Way Is Measured in Weekends, Not Dollars
Ask someone why they are selling their car privately instead of taking a quick cash offer, and the answer is...
2026 Volkswagen Tiguan Invoice Pricing: A Leaner, More Powerful Compact SUV Worth Negotiating
The 2026 Tiguan is a meaningfully different vehicle from the one it replaced, and understanding what changed before you negotiate...