
Taiwan November 2025: Mazda (+18.4%), Lexus (+13.6%) impress in negative market
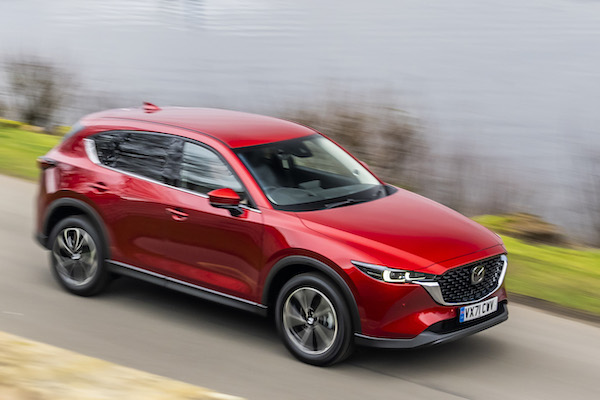
Mazda CX-5 sales are up 53.6% year-on-year in November.
It’s a disappointing month for the Taiwanese new car market at -6.9% year-on-year to 36,485 sales. The year-to-date tally is now down an equally weak -11.9% to 367,133. Toyota (-4.3%) remains the dominant force in the brands charts at 31.2% share vs. 30.5% so far this year. Lexus (+13.6%), Honda (+7.5%) and Mercedes (+5.7%) all post very solid scores below, with Hyundai (-2.1%) rounding out the Top 5. Mazda (+18.4%) and CMC (+0.3%) are the only additional gainers in the Top 10., with BMW (-30.6%), Ford (-9.3%) and Volkswagen (-7.7%) all falling faster than the market. Tesla is down -53.8% to just 532 sales.
Over in the models aisle, the Toyota Corolla Cross (-3.4%) is at 11.1% share, with the Toyota RAV4 (+31.6%) at a fair distance and 6.6%. Toyota monopolises the podium with the Yaris Cross (-0.8%) at #3. The Honda HR-V (+155.5%) surges yoy to repeat at #4 ahead of the CMC J Space (+76.5%) which ensures the Top 5 is identical to October. The Lexus RX (+122.6%), Mazda CX-5 (+53.6%) and Toyota Corolla Altis (+17.3%) stand out below. Notice also the MG G50 Plus breaking into the Top 20 at #19.
Previous month: Taiwan October 2025: Honda (+52.7%), CMC (+25.9%) stand out in shy market
One year ago: Taiwan November 2024: CMC J Space lands directly into Top 10
Full November 2025 Top 12 brands and Top 70 models below.
Taiwan November 2025 – brands:
PosBrandNov-25%/24Oct2025%/24PosFY241Toyota11,38731.2%– 4.3%1112,08330.5%– 1.9%112Honda2,5937.1%+ 7.5%220,2415.5%– 14.6%533Lexus2,5467.0%+ 13.6%326,8247.3%+ 0.9%224Mercedes1,9855.4%+ 5.7%620,5895.6%– 16.2%445Hyundai1,8044.9%– 2.1%516,9904.6%– 17.4%656CMC1,7624.8%+ 0.3%422,1976.0%+ 22.1%377BMW1,4844.1%– 30.6%715,7334.3%– 15.8%768Mazda1,4734.0%+ 18.4%812,4683.4%– 6.0%8129Volkswagen1,1163.1%– 7.7%12n/an/an/an/a1310Ford1,0292.8%– 9.3%98,4232.3%n/a13n/a11Mitsubishi9432.6%– 20.2%1111,8413.2%– 17.3%9912Suzuki9382.6%– 4.2%13n/an/an/an/an/an/aKia8452.3%n/an/a9,4632.6%+ 2.8%12n/an/aTesla5321.5%– 53.8%n/a11,0433.0%– 17.4%1111n/aNissann/an/an/a1011,4763.1%– 34.0%108
Taiwan November 2025 – models:
PosModelNov-25%/24Oct2025%/24PosFY241Toyota Corolla Cross4,03411.1%– 3.4%140,00910.9%+ 33.5%112Toyota RAV42,4156.6%+ 31.6%217,2374.7%– 6.3%233Toyota Yaris Cross1,3293.6%– 0.8%314,2343.9%– 8.8%544Honda HR-V1,2063.3%+ 155.5%47,6052.1%+ 50.6%10185CMC J Space1,1493.1%+ 76.5%515,6214.3%+ 2299.5%3506Lexus NX1,0893.0%+ 4.0%810,3372.8%– 11.3%667Toyota Corolla Altis9222.5%+ 17.3%68,7582.4%– 11.9%778Honda CR-V9202.5%– 33.9%97,9762.2%– 38.8%959Toyota Town Ace8942.5%– 45.8%714,5314.0%– 29.6%4210Mazda CX-57392.0%+ 53.6%204,7171.3%+ 8.0%162211Lexus RX5811.6%+ 122.6%165,4111.5%+ 10.5%132112Mitsubishi Delica5531.5%– 6.4%106,6721.8%– 6.5%111313Mercedes GLC Class5361.5%+ 8.7%126,2931.7%– 17.5%121214Ford Focus4651.3%+ 14.3%114,8171.3%– 22.9%151615Toyota Camry4631.3%– 13.1%283,3830.9%+ 15.5%253416Tesla Model 34621.3%+ 17.9%n/a2,3040.6%– 41.4%362517Lexus UX4421.2%+ 0.9%184,4641.2%+ 9.8%173118CMC Zinger4401.2%– 19.6%135,2631.4%– 24.7%141419MG G50 Plus4061.1%new24n/an/an/an/an/a20Nissan Kicks3931.1%– 25.1%194,4101.2%– 16.6%181921Hyundai Tucson3851.1%– 23.3%234,1691.1%– 43.8%201122Hyundai Custin3641.0%+ 14.1%272,7930.8%– 33.6%302823Ford Kuga3631.0%– 31.6%154,3001.2%+ 2.3%192324Hyundai Porter3611.0%– 24.2%173,8101.0%+ 35.5%213325Nissan X-Trail3571.0%– 8.0%143,5201.0%– 39.0%241726Mercedes GLA Class3420.9%+ 116.5%221,9680.5%– 0.7%39n/a27Kia Sportage3410.9%+ 19.6%302,9350.8%– 29.7%282628Suzuki Swift3360.9%+ 93.1%312,8800.8%+ 26.3%294029Honda Fit3300.9%– 18.9%213,7751.0%– 18.3%222030Toyota Vios2810.8%– 3.1%253,7631.0%– 14.8%232431Mazda CX-302800.8%+ 26.1%372,5220.7%+ 12.5%354232Hyundai Venue2710.7%– 21.9%332,7880.8%– 9.7%323233Hyundai Mufasa2650.7%new341,8730.5%new42 –34VW Tiguan2640.7%– 31.4%26n/an/an/an/a3635Nissan Sentra2630.7%– 31.0%322,7890.8%– 30.4%313036Luxgen n72540.7%– 52.0%383,0410.8%– 54.1%271537Suzuki Jimny2470.7%– 53.0%35n/an/an/an/an/a38VW Golf2240.6%– 16.7%50n/an/an/an/a3539Suzuki Ignis2180.6%+ 162.7%401,1800.3%+ 19.6%n/an/a40MG HS2150.6%– 26.6%362,7110.7%– 73.7%33941Mercedes E Class2140.6%– 30.1%n/a1,9470.5%– 18.4%403942MG ZS2100.6%+ 101.9%391,3130.4%– 69.8%502943Toyota bZ4X2070.6%n/an/an/an/an/an/an/a44Skoda Octavia2000.5%– 0.5%n/a1,4900.4%– 26.5%464445BMW X31930.5%#DIV/0!42n/an/an/an/an/a46Toyota Alphard1770.5%+ 32.1%413,1010.8%#VALUE!26n/a47Mazda CX-601770.5%+ 30.1%441,1600.3%– 42.6%n/a4548BMW X11740.5%– 20.2%43n/an/an/an/an/a49CMC Veryca1730.5%– 69.1%n/a1,3130.4%– 87.5%n/a850Mazda31700.5%– 31.2%292,5570.7%– 6.1%343751Lexus ES1680.5%+ 42.4%n/a1,7740.5%– 11.1%444752Mitsubishi Colt Plus1630.4%+ 0.0%481,8300.5%– 15.0%434353Fuso Canter1540.4%n/an/a1,9190.5%n/a41n/a54Skoda Kodiaq1500.4%– 59.9%n/a9050.2%#VALUE!n/an/a55Lexus LBX1380.4%– 35.5%472,2310.6%– 7.3%374156Honda Civic1370.4%+ 1.5%n/a8200.2%#VALUE!n/an/a57Volvo XC401350.4%– 41.0%46n/an/an/an/a2758BMW iX11340.4%+ 0.0%451,3900.4%#VALUE!48n/a59Kia Picanto1250.3%#DIV/0!n/an/an/an/an/an/a60Volvo XC601240.3%– 24.8%49n/an/an/an/a4861Mercedes GLB Class1160.3%n/an/an/an/an/an/an/a62Toyota Granvia+Hiace1140.3%– 16.8%n/an/an/an/an/an/a63Lexus LM1100.3%n/an/a2,0980.6%n/a38n/a64BMW 1 Series1100.3%+ 223.5%n/a1,4340.4%#VALUE!47n/a65Toyota Crown1100.3%– 40.9%n/a9710.3%– 49.2%n/a4966BMW 3 Series1090.3%+ 13.5%n/a1,0220.3%– 27.2%n/an/a67Toyota Corolla Sport1080.3%+ 38.5%n/a7620.2%– 24.8%n/an/a68BMW iX1070.3%n/an/an/an/an/an/an/a69Skoda Kamiq1070.3%n/an/a8200.2%n/an/an/a70BMW 2 Series1050.3%– 76.2%n/a1,3150.4%+ 8.3%49n/a
Source: u-car.com.tw

More Stories
Ferrari Denies Claims That Buyers Must Order the Luce EV to Get Higher Models
Ferrari’s first fully electric vehicle, the Luce, has already become one of the most talked-about cars to come out of...
China new models May 2026: Audi E7X and Onvo L80 appear
Onvo L80 Now that May 2026 has been studied, let’s focus on the latest launches on the Chinese market. Once...
World Full Year 2025: Discover the Top 500 best-selling models (BSCB Exclusive)
This content is for members only. Visit the site and log in/register to read.
McLaren Marks a Historic Milestone with a Special Artura
McLaren Automotive has revealed a striking new limited-edition model: the McLaren Artura 1000GP by MSO. Created to celebrate McLaren Racing’s...
The ROI Equation, Fleet Longevity and Truck Parts Quality
The math of fleet management has changed. For years, deciding to replace an aging tractor was mainly about mileage, age,...
Electric Rides That Make Weekend Camping and Local Exploring Easier
Outdoor travel does not need to be far away When people think about outdoor travel, they often imagine long road...