
Italy November 2025: Scrappage scheme boosts BEVs to 12.2% share, BYD Dolphin Surf and Leapmotor T03 up
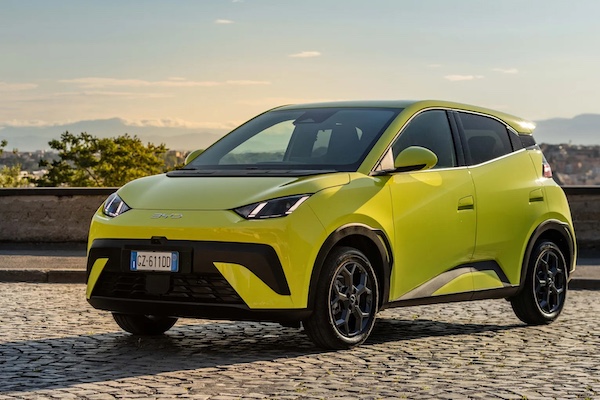
The BYD Dolphin Surf ranks #11 in Italy in November.
The Italian new car market is stable in November at 124,222 units, 45 less than in November 2024. YTD volumes are off -2.4% to 1,417,621. The event of the month is the record share of BEVs, up to 12.2%, smashing the previous best of 8.3% reached in June 2024. BEV sales were at 5.2% through October and now stand at 5.8%. In the detail, BEVs are up 131.9% year-on-year in November to 15,304 and 12.2% share vs. 5.2% in November and up 38% year-to-date to 82,897 and 5.8% share vs. 4.1% YTD. Adding PHEV, the share of rechargeable cars hits 19.4% this month vs. a previous best of 11.8%. The reason for this surge is a new scrappage program that started in October, offering a €11,000 discount on the purchase of a BEV when scrapping an old car with Euro 5 or earlier emissions rating. This means the car must have been registered before September 2015. The incentive It also only applies to less well-off families, living in urban areas with more than 50,000 inhabitants.
The Leapmotor T03 is up to #15.
The scheme could boost sales by about 60,000 registrations according to Automotive News. It has so far had little impact on the top of the brands ranking however, with Fiat (+23.1%) staying in pole position but at only 8.7% share vs. 9.5% YTD and only 34 units above Toyota (-3.4%). In fact the Top 5 is unchanged on last month: Volkswagen (-16.6%) and Dacia (-12.7%) follow while BMW (-4.3%) ranks at a record #5 for the 5th month in a row. Audi (+13.8%) is the only additional gainer in the Top 10 just as Hyundai (-1.8%) resists but Renault (-20.7%), Peugeot (-20.7%) and Jeep (-14%) all sink. Below MG (+14.2%), BYD (+534.2%) smashes all its records at #15 with 3,526 sales and 2.8% share (previous bests #19 last July and 2,471 sales and 2% share last September). Cupra is up 45.6% and Leapmotor leaps a surreal 2887.8% to #21 and 1.8% share thanks to the scrappage scheme as we’ll see further down.
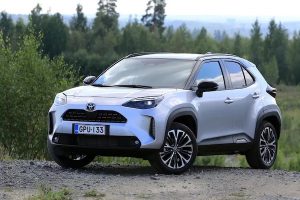
Model-wise, the Fiat Panda (+2.7%) stays on top but with just 5.5% share vs. 6.8% through November. The Dacia Sandero (-28.1%) is back up two spots on last month to #2 despite freefalling year-on-year. The Toyota Yaris Cross (+14.1%) is very solid and ranks #3, down one rank on a record-breaking #2 last month. The Jeep Avenger (-11.3%) and Toyota Yaris (-11.4%) follow. Toyota manages to place three models in the Top 6 with the Aytgo X (+65.7%) up 7 spots on October to #6. The event of the month is the stunning success of two Chinese models, linked with the scrappage scheme. The BYD Dolphin Surf ranks as high as #11 with 1.8% share, and is available from €8,310 after incentives. The Leapmotor T03 is #15 and sees its price reduced to €4,900 after incentives and a further €3,000 rebate from the manufacturer. Its advertising campaign promotes it as “cheaper than your bike” (see above).
Previous month: Italy October 2025: Toyota Yaris Cross reaches record ranking at #2
One year ago: Italy November 2024: Toyota and Volkswagen top Fiat
Full November 2025 Top 53 All brands and Top 50 models below.
Italy November 2025 – brands:
PosBrandNov-25%/24Oct2025%/24PosFY241Fiat10,8278.7%+ 23.1%1134,5599.5%– 2.3%112Toyota10,7938.7%– 3.4%2111,8587.9%– 1.6%223Volkswagen8,9137.2%– 16.6%3103,5317.3%– 6.7%334Dacia7,6596.2%– 12.7%490,7966.4%+ 0.0%445BMW6,1735.0%– 4.3%567,7674.8%+ 2.2%776Audi6,0034.8%+ 13.8%763,7024.5%– 1.1%8107Renault5,7134.6%– 20.7%668,9854.9%– 14.4%658Peugeot4,7453.8%– 20.7%872,2045.1%– 1.4%569Jeep4,2823.4%– 14.0%1059,2894.2%– 7.9%9910Hyundai4,0793.3%– 1.8%1443,6363.1%– 6.2%141311Mercedes4,0593.3%– 8.2%949,4143.5%+ 4.5%121212Citroen4,0483.3%– 12.6%1151,7133.6%– 2.3%111113Ford3,9323.2%– 28.1%1257,8014.1%– 10.4%10814MG3,6362.9%+ 14.2%1346,6273.3%+ 27.9%131615BYD3,5262.8%+ 534.2%2220,2751.4%+ 848.8%223716Kia3,5042.8%– 7.6%1641,0472.9%– 8.7%151417Skoda3,1852.6%– 5.3%1535,5702.5%+ 2.2%171718Opel2,4672.0%– 7.4%1735,6692.5%– 14.5%161519Cupra2,3191.9%+ 45.6%2120,3161.4%+ 34.0%212420Nissan2,3091.9%– 4.5%2029,8162.1%– 8.3%181921Leapmotor2,2111.8%+ 2887.8%375,0750.4%#DIV/0!37n/a22Omoda+Jaecoo2,2041.8%+ 384.4%2313,2860.9%+ 573.7%263823Suzuki2,1971.8%– 21.6%1829,1792.1%– 16.5%191824Alfa Romeo1,9061.5%– 23.1%1926,5921.9%+ 27.3%202125Mini1,5561.3%+ 45.0%2514,4721.0%+ 26.2%242726DR Motor1,5351.2%– 13.1%2417,0401.2%– 1.1%232327Volvo1,3161.1%– 5.5%2612,9870.9%– 26.6%252228Tesla1,2811.0%+ 58.5%3810,3280.7%– 27.7%272529Mazda1,0880.9%– 10.5%289,8930.7%– 24.8%282630Honda1,0130.8%+ 53.3%279,0580.6%+ 29.7%303131Lancia9110.7%+ 12.2%299,1740.6%– 70.9%292032Seat6740.5%+ 1.7%337,5380.5%– 30.7%312833Porsche6110.5%– 1.3%326,3110.4%– 16.9%333034Lexus5470.4%– 11.5%316,0100.4%+ 7.1%353335Land Rover4900.4%– 34.9%346,4450.5%– 27.5%322936EVO4700.4%– 30.2%305,9820.4%– 1.5%343237EMC3400.3%+ 169.8%352,8070.2%+ 132.0%384138DS2480.2%– 43.5%364,3950.3%– 10.8%363439Subaru1890.2%– 25.6%402,2800.2%+ 47.9%394040Sportequipe1650.1%+ 129.2%391,9270.1%+ 125.6%404341Lynk & Co1530.1%+ 292.3%435980.0%– 38.9%484242DFSK1120.1%+ 77.8%411,0690.1%#DIV/0!43n/a43Maserati990.1%– 10.8%421,6180.1%– 23.8%413944Ferrari710.1%+ 51.1%447700.1%+ 4.6%444545Polestar600.0%+ 5.3%454670.0%+ 60.5%494946Lamborghini440.0%+ 83.3%465450.0%+ 15.0%474647Smart290.0%– 81.5%486990.0%– 74.1%453648Mitsubishi240.0%– 87.5%471,3060.1%– 57.0%423549Lotus110.0%– 47.6%492250.0%– 31.4%514850Aston Martin60.0%– 25.0%50920.0%– 2.1%535151Mahindra10.0%– 94.4%516660.0%+ 215.6%465052SsangYong00.0%– 100.0% –2460.0%– 45.6%504753Jaguar00.0%– 100.0% –1850.0%– 78.8%5244 –Others4880.4%+ 232.0% –2,7900.2%+ 227.0% – –
Italy November 2025 – models:
PosModelNov-25%/24Oct2025%/24PosFY241Fiat Panda6,8275.5%+ 2.7%196,2626.8%+ 0.9%112Dacia Sandero3,8853.1%– 28.1%446,5633.3%– 18.5%223Toyota Yaris Cross3,5352.8%+ 14.1%234,5882.4%+ 0.2%554Jeep Avenger3,3962.7%– 11.3%345,7013.2%+ 18.6%335Toyota Yaris3,0272.4%– 11.4%632,0992.3%+ 7.3%786Toyota Aygo X2,9552.4%+ 65.7%1322,4201.6%+ 12.9%14197Citroen C32,5992.1%– 34.9%536,3632.6%+ 2.0%448Ford Puma2,3311.9%– 4.9%1425,1121.8%– 4.9%11139Renault Clio2,3041.9%– 12.8%926,8081.9%– 19.3%10610Renault Captur2,2161.8%– 18.8%1123,7021.7%– 19.6%131011BYD Dolphin Surf2,1871.8%newn/a3,4910.2%newn/a –12VW Tiguan2,1211.7%– 7.8%1722,1881.6%+ 20.5%152113VW T-Roc2,0821.7%– 30.7%724,7911.7%– 12.2%121114MG ZS1,9321.6%– 21.6%1027,2411.9%+ 8.2%91415Leapmotor T031,8811.5%+ 2983.6%n/a4,0240.3%+ 2547.4%n/an/a16Peugeot 2081,8771.5%– 38.8%1830,1272.1%+ 0.8%8717VW T-Cross1,7301.4%– 20.3%1520,3451.4%– 8.0%171618BMW X11,7081.4%– 16.8%1220,3161.4%+ 4.3%192019Fiat Grande Panda1,7071.4%new169,9550.7%new39 –20Dacia Duster1,6911.4%+ 18.3%832,7272.3%+ 24.9%61221Opel Corsa1,5291.2%– 19.3%2920,4351.4%– 18.3%161522Hyundai i101,5121.2%+ 29.6%2613,8941.0%– 5.6%252623Dacia Spring1,4431.2%– 4.2%n/a4,4690.3%+ 50.5%n/an/a24Fiat 6001,3981.1%+ 40.8%2020,3371.4%+ 274.2%18n/a25Audi A31,3121.1%+ 63.0%2214,3471.0%+ 27.8%243726Peugeot 30081,2151.0%+ 65.8%2115,2291.1%+ 43.5%233927Nissan Qashqai1,1861.0%+ 3.5%4015,6891.1%– 8.8%222228Kia Picanto1,1630.9%+ 1.2%3112,9930.9%+ 10.5%303429Kia Sportage1,1220.9%– 34.8%1917,6731.2%– 16.1%201830Alfa Romeo Junior1,0940.9%– 0.9%3013,3800.9%n/a27n/a31Peugeot 20081,0900.9%– 26.0%2717,4661.2%– 20.7%211732Hyundai Tucson1,0710.9%– 25.6%2312,2370.9%+ 9.8%323633VW Golf1,0450.8%– 28.5%2813,1230.9%+ 12.0%293134Omoda 51,0060.8%n/an/an/an/an/an/an/a35Tesla Model 39610.8%+ 321.5%n/a5,4780.4%– 24.9%n/an/a36Cupra Formentor9450.8%+ 24.7%38n/an/an/an/a4437Audi Q39310.7%– 22.0%n/a9,7530.7%– 41.3%412338MG 39260.7%+ 86.7%3612,6750.9%+ 252.3%31n/a39Lancia Ypsilon9110.7%+ 12.3%399,1710.6%– 70.9%44940Nissan Juke9100.7%– 4.0%3711,0720.8%– 0.2%343541Suzuki Swift9080.7%– 9.6%3310,7060.8%+ 14.6%354342BYD Seal U8880.7%+ 150.1%2513,1570.9%+ 1444.2%28n/a43Cupra Leon8770.7%n/an/an/an/an/an/an/a44Toyota C-HR8620.7%– 45.0%4913,8041.0%– 5.6%262545Audi A58570.7%+ 378.8%n/a7,2090.5%+ 795.5%n/an/a46Suzuki Vitara8550.7%+ 6.7%429,6970.7%– 4.5%424147Citroen C3 Aircross8460.7%+ 6407.7%n/an/an/an/an/an/a48Mercedes GLC8320.7%+ 29.6%487,5970.5%+ 50.0%n/an/a49BMW X38190.7%+ 3.7%n/a8,4450.6%+ 27.0%49n/a50Audi Q58140.7%+ 27.4%477,6220.5%+ 18.1%n/an/an/aSkoda Fabia8120.7%– 7.4%3510,4470.7%+ 17.6%3645n/aSkoda Kamiq7680.6%– 6.3%3210,0570.7%+ 12.2%3849n/aMercedes GLA7650.6%– 29.7%2411,7680.8%– 3.7%3329n/aAudi A17640.6%– 2.1%508,9910.6%n/a46n/an/aVolvo XC407600.6%+ 8.9%447,9810.6%+ 4.9%5050n/aBMW Serie 16900.6%– 15.1%439,0270.6%+ 20.9%45n/an/aAlfa Romeo Tonale6620.5%– 24.5%4510,0870.7%– 24.7%3728n/aFord Kuga6310.5%– 30.0%n/a9,5080.7%– 23.0%4333n/aDR 5.05780.5%– 44.6%n/a8,5440.6%– 2.1%4748n/aFord Focus5660.5%– 41.2%n/a9,9090.7%– 9.8%4038n/aFord Tourneo Courier300.0%– 96.7%n/a8,4870.6%+ 6.6%48n/a
Source: UNRAE

More Stories
Montenegro May 2026: Renault Captur stays #1, BYD Atto 2 on podium
The BYD Atto 2 ranks #3 for its first Top 10 finish in Montenegro. Based on data shared with us...
Hyundai’s Next Electric N Cars Could Get Even Wilder With Fake Idling, Backfires, and More Driver Feel
Hyundai’s N division has never been shy about having fun, and that spirit appears ready to carry even deeper into...
Tesla’s Full Self-Driving Is Causing Accidents: Here’s Who Florida Law Says Is Responsible
Tesla’s Full Self-Driving (FSD) technology represents one of the automotive industry’s most ambitious ventures into autonomous driving. While the system...
2026 GMC Terrain Invoice Pricing: What Dealers Pay After Two Price Hikes This Year
If the sticker price on a 2026 GMC Terrain feels higher than you remember from earlier in the model year,...
Porsche Sonderwunsch Takes Toy Story 5 911s From Imagination to Reality – Car Characters Explained Video
Porsche’s wild Disney and Pixar collaboration is getting another moment in the spotlight, this time through a new behind-the-scenes video...
How to Sell Your Used Car Fast Without the Hassle of Private Buyers
Image by kues1 on Magnific Selling a used car the traditional way can be a genuine headache. You take the...