
Puerto Rico (USA) First Half 2025: Toyota RAV4 #1 again, Kia Seltos up to #2
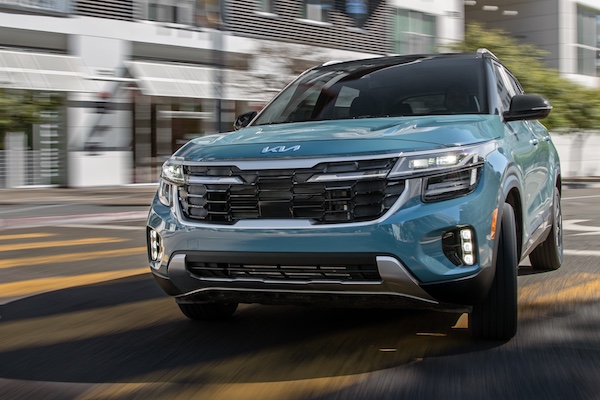
The Kia Seltos is only outsold by the Toyota RAV4 in Puerto Rico.
58,284 new light vehicles found a buyer in Puerto Rico over the First Half of 2025, a -4.5% year-on-year drop. Toyota (-1.8%) manages to improve its market share from 25.3% to 26.1% to easily stay in the lead of the manufacturers charts. Hyundai (-4.6%) is unchanged at 16.5% while Kia improves slightly to 12.6%. In contrast Ford Motor (-22.1%), Mitsubishi (-13.2%) and Nissan (-15.9%) are all hit hard. Stellantis (-5.4%) fares better unlike in the rest of the US. Mercedes (+92.8%), Mini (+86.9%), BMW (+40.8%), Lexus (+37.7%), Porsche (+29.5%) and Mazda (+23.4%) all surge ahead below.
The Toyota RAV4 (+18.7%) remains the favourite of Puerto Rican buyers, even tightening its grip on the market as its share grows from 7.4% to 9.2%. The Kia Seltos (+9.7%) leaps up two spots on last year to land in a beautiful 2nd place with 5.4% of the market. It overtakes the Toyota Corolla (-9.7%) and Corolla Cross (-11.7%) both struggling. The Hyundai Venue (+5.8%) stays at #5 but the Kia Soul (+58.4%) at #6 (+9) and Hyundai Elantra (+21.6%) at #7 (+2) both climb up the charts. The Toyota Tacoma (+30.3%) also impresses at #10. The Ford F-Series (-19.2%) is the only US model in the Top 15 at #9.
Previous post: Puerto Rico (USA) Full Year 2024: Toyota monopolises podium, RAV4 repeats at #1
Full H1 2025 Top 30 All manufacturers and Top 50 models below.
Puerto Rico (USA) H1 2025 – brands:
PosBrandH1 2025%/24H1 2024%PosFY241Toyota15,18726.1%– 1.8%15,46425.3%112Hyundai9,60616.5%– 4.6%10,06716.5%223Kia7,34112.6%– 2.1%7,50112.3%334Ford Motor4,8608.3%– 22.1%6,23810.2%445Mitsubishi4,3007.4%– 13.2%4,9558.1%556Nissan3,9386.8%– 15.9%4,6807.7%667Stellantis3,5826.1%– 5.4%3,7866.2%778Honda2,2803.9%– 0.7%2,2963.8%889BMW1,2072.1%+ 40.8%8571.4%10910Mercedes9391.6%+ 92.8%4870.8%141411Lexus9171.6%+ 37.7%6661.1%111112General Motors8691.5%– 2.7%8931.5%91013Mazda7591.3%+ 23.4%6151.0%131314Volkswagen5040.9%– 19.1%6231.0%121215Acura3320.6%+ 19.0%2790.5%171516Mini2860.5%+ 86.9%1530.3%212017Porsche2720.5%+ 29.5%2100.3%181818Audi2560.4%– 9.5%2830.5%151619Volvo2000.3%– 28.8%2810.5%161720Infiniti1680.3%– 13.0%1930.3%191921Subaru1570.3%+ 26.6%1240.2%232322Land Rover1500.3%– 16.2%1790.3%202123Genesis1420.2%+ 2.9%1380.2%222224Lamborghini110.0%– 8.3%120.0%252525Ferrari90.0%+ 28.6%70.0%272626Bentley70.0%– 22.2%90.0%262827Alfa Romeo20.0%– 90.0%200.0%242428Fiat20.0%– 60.0%50.0%292929Maserati10.0%– 80.0%50.0%2827
Puerto Rico (USA) H1 2025 – models:
PosModelH1 2025%/24H1 2024%PosFY241Toyota RAV45,3659.2%+ 18.7%4,5207.4%112Kia Seltos3,1625.4%+ 9.7%2,8824.7%443Toyota Corolla2,9995.1%– 9.7%3,3215.4%224Toyota Corolla Cross2,6174.5%– 11.7%2,9654.9%335Hyundai Venue2,5814.4%+ 5.8%2,4404.0%556Kia Soul2,0043.4%+ 58.4%1,2652.1%15137Hyundai Elantra1,9613.4%+ 21.6%1,6132.6%988Hyundai Kona1,8853.2%– 10.1%2,0973.4%799Ford F-Series1,8563.2%– 19.2%2,2963.8%6610Toyota Tacoma1,8223.1%+ 30.3%1,3982.3%131011Mitsubishi Outlander 1,6732.9%+ 8.6%1,5412.5%101212Hyundai Tucson1,6422.8%– 17.9%1,9993.3%8713Nissan Kicks1,3212.3%– 9.4%1,4582.4%121114Mitsubishi Outlander Sport1,0441.8%– 18.2%1,2772.1%141515Mitsubishi Mirage1,0231.8%– 32.3%1,5122.5%111416Nissan Rogue1,0171.7%– 18.0%1,2402.0%161617Ram Pickup (est)9491.6%– 5.4%1,0031.6%191718Honda CR-V9401.6%+ 0.4%9361.5%212019Nissan Versa7961.4%– 27.4%1,0971.8%181820Hyundai Santa Cruz7501.3%+ 5.5%7111.2%252421Ford Maverick7441.3%– 3.0%7671.3%232522Kia Sportage7371.3%– 21.3%9361.5%201923Ford Transit (est)6561.1%– 22.1%8421.4%222224Kia K46241.1%new00.0% – –25Jeep Wrangler6191.1%– 14.6%7251.2%242326Ford Bronco Sport5791.0%– 2.7%5951.0%312927Ford Ranger5581.0%+ 123.2%2500.4%463128Mitsubishi Eclipse Cross5200.9%– 16.8%6251.0%292729BMW X54840.8%+ 173.4%1770.3%554030Hyundai Santa Fe4470.8%– 32.1%6581.1%272831Lexus NX4290.7%+ 47.4%2910.5%413632Jeep Gladiator (est)4050.7%– 5.4%4280.7%373033Honda HR-V3980.7%– 19.1%4920.8%353234Mazda CX-53840.7%+ 49.4%2570.4%454135Jeep Grand Cherokee3710.6%– 33.9%5610.9%332136Toyota Grand Highlander3570.6%– 32.5%5290.9%343937Toyota Corolla Hatchback3410.6%– 48.0%6561.1%28n/a38Toyota 4Runner3360.6%– 12.0%3820.6%384639Kia Sorento3190.5%+ 59.5%2000.3%504540Toyota Highlander2970.5%– 48.4%5760.9%323341Mercedes GLC2950.5%+ 235.2%880.1%69n/a42Mercedes GLE2810.5%+ 360.7%610.1%75n/a43Kia Carnival2650.5%– 1.1%2680.4%423844Nissan Pathfinder2470.4%+ 33.5%1850.3%53n/a45BMW X3/X42390.4%+ 46.6%1630.3%58n/a46Jeep Compass2280.4%– 50.6%4620.8%363547Honda Civic2170.4%– 8.1%2360.4%474448Ford Explorer2160.4%– 16.3%2580.4%444749VW Tiguan2140.4%– 4.5%2240.4%484350Hyundai Palisade2080.4%– 38.5%3380.6%3937
Source: GUIA


More Stories
The ROI Equation, Fleet Longevity and Truck Parts Quality
The math of fleet management has changed. For years, deciding to replace an aging tractor was mainly about mileage, age,...
Electric Rides That Make Weekend Camping and Local Exploring Easier
Outdoor travel does not need to be far away When people think about outdoor travel, they often imagine long road...
2026 Subaru Crosstrek Dealer Cost Breakdown: Invoice Price and How to Save Near You
If you are shopping for a 2026 Subaru Crosstrek and want to know what dealers are actually paying, what a...
Discover the Fun of PH Bingo Online on GameZone
PH Bingo online has become one of the most recognizable digital gaming formats in the Philippines because it builds on a...
2026 Honda HR-V Invoice Price, Dealer Cost, and How to Get the Best Deal Near You
If you are shopping for a 2026 Honda HR-V and want to know what dealers are actually paying, what a...
2026 Volkswagen Taos True Dealer Cost: Invoice Pricing and the Best Deal Near You
If you are shopping for a 2026 Volkswagen Taos and want to know what dealers are actually paying, what a...