
Slovakia May 2025: Skoda Octavia leads, Hyundai i20 surges to #4
The Hyundai i20 sees its sales jump 171.1% year-on-year in May.
7,651 new cars found a buyer in Slovakia in May, a correct 4.9% year-on-year improvement. The YTD tally remains in negative however at -5.3% to 36,350. Once again brand leaders Skoda (+10.2%) and Kia (+25%) both outpace the market to 21.8% and 9.4% share respectively. Volkswagen (-6.8%) struggles but is just one sale below Kia while Toyota (-20%), also in poor form, is 11 units further down. Below a lukewarm Hyundai (+2.2%), Dacia (-15.7%) rallies back up 6 spots on April but endures a steep YoY fall. Ford (+124.3%), Peugeot (+68.9%) and Citroen (+61.6%) all surge ahead.
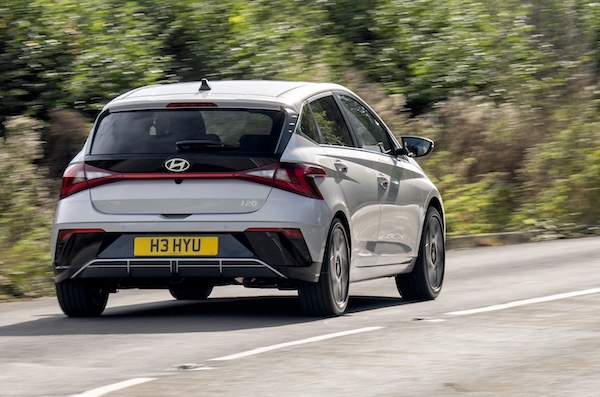
Over in the models charts, the Skoda Octavia (+3.6%) easily retains the pole position with 5.3% share ahead of the Kia Ceed (+91.4%). Note 63% of Octavia and 74% of Ceed customers go for the station wagon version. The Skoda Fabia (+10.8%) closes out the podium as it did last month and YTD. The Hyundai i20 (+171.1%) shoots up to #4, its best ranking since June 2023 when it was also #4. Skoda places the Karoq (+19.7%) at #5, the Kodiaq (+1.1%) at #6, the Kamiq (-1.6%) at #8 and the Scala (-18.7%) at #10. The Hyundai Tucson (+39%) is up two spots on last month to #9. Among recent launches, the Skoda Elroq ranks #26 (-2 on April), the VW Tayron at #36 (+6) and the Dacia Bigster at #41 (+57).
Previous month: Slovakia April 2025: Skoda (+21.6%), Kia (+24.6%) top solid market
One year ago: Slovakia May 2024: VW T-Cross (+220.3%), Hyundai i30 (+87.3%) stand out in negative market
Full May 2025 Top 38 All brands and Top 268 All models below.
Slovakia May 2025 – brands:
PosBrandMay-25%/24Apr2025%/24PosFY241Skoda1,67021.8%+ 10.2%17,58320.9%– 6.6%112Kia7199.4%+ 25.0%23,5499.8%+ 1.6%233Volkswagen7189.4%– 6.8%33,4029.4%– 3.8%344Toyota7079.2%– 20.0%53,3729.3%– 22.6%425Hyundai6939.1%+ 2.2%42,9358.1%– 23.5%556Dacia2903.8%– 15.7%121,3063.6%– 28.1%667Citroen2653.5%+ 61.6%61,2463.4%+ 55.8%8128Mercedes2593.4%– 0.4%111,2303.4%– 13.0%979Ford2583.4%+ 124.3%71,0542.9%+ 37.2%111310Peugeot2553.3%+ 68.9%81,2853.5%+ 38.9%7811Renault2363.1%+ 36.4%139232.5%– 6.2%13912BMW2102.7%– 4.1%101,1253.1%+ 2.3%101013Audi1992.6%+ 64.5%99642.7%+ 96.7%121514Opel1532.0%+ 44.3%167612.1%+ 54.4%141615Suzuki1341.8%– 41.0%147242.0%– 39.5%151116MG1011.3%– 32.7%156051.7%+ 39.4%171717Jeep881.2%+ 319.0%184061.1%+ 217.2%182818Cupra751.0%+ 82.9%242600.7%+ 36.1%252719Seat720.9%– 11.1%173651.0%– 13.5%202020Mazda720.9%– 16.3%213190.9%– 37.5%231921Ssangyong670.9%– 42.7%263901.1%– 18.8%191822Lexus670.9%– 26.4%223571.0%– 25.0%212123Honda590.8%+ 37.2%193060.8%+ 19.1%242324Volvo560.7%– 24.3%203400.9%– 10.1%222225Land Rover560.7%+ 47.4%272480.7%+ 25.3%262526Nissan460.6%– 42.5%236221.7%– 17.9%161427Porsche260.3%– 13.3%301240.3%– 16.8%272928Alfa Romeo250.3%+ 150.0%251210.3%+ 132.7%283229Subaru170.2%– 50.0%281090.3%– 36.3%302630Fiat150.2%– 55.9%291160.3%– 37.6%292431Mitsubishi150.2%– 16.7%31660.2%– 33.3%313032Mini130.2%+ 18.2%32490.1%– 21.0%323133MAN50.1%+ 400.0% –80.0%+ 166.7%373834DS30.0%– 57.1%33320.1%+ 10.3%333335Jaguar30.0%– 25.0%36120.0%– 52.0%363436DongFeng20.0%– 60.0%34160.0%– 36.0%343537Voyah10.0%new35130.0%new354038Ineos10.0%– 80.0%3770.0%– 53.3%3836
Slovakia May 2025 – models:
PosModelMay-25%/24Apr2025%/24PosFY241Skoda Octavia4055.3%+ 3.6%11,8325.0%– 18.9%112Kia Ceed3104.1%+ 91.4%21,5544.3%+ 44.8%243Skoda Fabia3094.0%+ 10.8%31,2293.4%– 23.1%324Hyundai i202633.4%+ 171.1%68152.2%+ 41.0%7165Skoda Karoq2072.7%+ 19.7%41,0712.9%+ 14.7%476Skoda Kodiaq1922.5%+ 1.1%88762.4%+ 29.6%6107Kia Sportage1812.4%+ 5.2%59192.5%– 10.9%558Skoda Kamiq1802.4%– 1.6%77662.1%– 25.9%1069Hyundai Tucson1642.1%+ 39.0%116911.9%– 1.8%111210Skoda Scala1572.1%– 18.7%127812.1%– 11.7%9811Hyundai i301331.7%– 55.1%97992.2%– 54.7%8312Toyota Corolla1301.7%– 27.4%136651.8%– 24.0%131113VW T-Cross1291.7%– 37.1%165101.4%– 29.3%161314Citroen C31241.6%+ 29.2%106691.8%+ 59.7%122215Toyota RAV41151.5%– 31.1%225001.4%– 28.0%172016Toyota Yaris Cross1141.5%+ 52.0%373310.9%– 40.7%292517Skoda Superb1111.5%+ 29.1%175801.6%– 0.3%151418Dacia Duster951.2%– 55.0%235821.6%– 39.6%14919Dacia Sandero901.2%+ 36.4%353370.9%– 26.3%282320VW Taigo851.1%– 2.3%213891.1%– 8.9%232721Jeep Avenger841.1%+ 833.3%313561.0%+ 1171.4%259022VW Tiguan841.1%– 7.7%144971.4%– 8.3%181523Renault Captur811.1%+ 76.1%392810.8%+ 13.3%364424Toyota Yaris811.1%+ 20.9%184911.4%+ 57.4%192425MG ZS801.0%– 34.4%204311.2%+ 38.1%222626Skoda Elroq741.0%new242560.7%new40 –27Peugeot 2008660.9%+ 144.4%921870.5%+ 8.1%533528Ford Transit/Tourneo Custom650.8%+ 182.6%333430.9%+ 203.5%276829Peugeot 3008650.8%+ 306.3%343270.9%+ 227.0%304530VW Golf630.8%– 51.2%254851.3%– 21.0%201731VW Multivan620.8%+ 106.7%362900.8%+ 128.3%357132Kia Stonic610.8%– 31.5%282700.7%– 36.2%372833Ford Puma600.8%+ 650.0%1061470.4%– 23.0%635734Toyota Corolla Cross600.8%+ 66.7%262950.8%+ 3.1%334135Kia Xceed590.8%+ 47.5%382450.7%– 30.0%413136VW Tayron560.7%new421480.4%new62 –37Ford Kuga550.7%+ 71.9%152910.8%+ 24.9%343638Suzuki SX4 S-Cross550.7%– 59.3%293130.9%– 49.4%322139Citroen Berlingo520.7%+ 108.0%621910.5%+ 430.6%529140VW Touareg520.7%+ 108.0%521850.5%+ 15.6%545641Dacia Bigster500.7%new98780.2%new111 –42Hyundai Kona500.7%– 41.9%412250.6%– 30.6%443443Mercedes GLE500.7%– 13.8%531750.5%– 27.1%554844Toyota C-HR480.6%– 43.5%323511.0%– 32.8%261945Suzuki Vitara470.6%– 25.4%272670.7%– 37.5%392946Audi Q8460.6%+ 228.6%471910.5%+ 154.7%518747Dacia Jogger460.6%– 30.3%402670.7%– 21.9%383348Renault Trafic460.6%– 14.8%581130.3%– 49.8%763849Toyota Proace City Verso450.6%– 67.2%45950.3%– 79.2%934350VW T-Roc430.6%– 25.9%601470.4%– 45.8%644251Kia Proceed 410.5%+ 46.4%701950.5%– 15.2%495552Ford Courier400.5%+ 166.7%591090.3%+ 105.7%799453SsangYong Korando400.5%– 40.3%682290.6%– 15.8%433754Toyota Aygo X400.5%+ 66.7%542030.6%+ 56.2%484955Toyota Proace400.5%– 18.4%613250.9%+ 30.0%313256VW Touran400.5%+ 122.2%492140.6%+ 181.6%474657Mercedes GLC380.5%+ 0.0%482220.6%+ 4.7%454758Peugeot 208360.5%+ 50.0%193861.1%+ 77.1%243059VW ID.7360.5%+ 260.0%791050.3%+ 228.1%8414260Opel Corsa350.5%+ 169.2%552190.6%+ 58.7%465161Opel Frontera340.4%new163410.1%new147 –62Cupra Terramar320.4%new80950.3%new9223163Audi A3310.4%+ 244.4%561220.3%+ 121.8%7011064Citroen C4310.4%+ 19.2%462290.6%– 8.4%423965Kia Sorento310.4%+ 6.9%721570.4%+ 20.8%605866Seat Leon310.4%+ 24.0%501630.4%+ 52.3%576367Mercedes G Class300.4%+ 233.3%651590.4%+ 57.4%598568Peugeot 508300.4%+ 328.6%123890.2%– 17.6%1015969BMW X1290.4%+ 52.6%571490.4%+ 65.6%618670BMW X5290.4%+ 3.6%991240.3%– 12.1%696671Cupra Formentor290.4%+ 31.8%116890.2%– 18.3%998972Lexus NX290.4%– 37.0%631620.4%– 27.4%585273Nissan Qashqai280.4%– 30.0%444451.2%– 18.0%211874Audi A5260.3%+ 420.0%94840.2%+ 265.2%10417175BMW X3260.3%+ 73.3%1071240.3%+ 15.9%689376BMW X7260.3%+ 8.3%75870.2%– 29.3%1028177Skoda Enyaq260.3%+ 100.0%101830.2%+ 3.8%10713578Audi Q3250.3%+ 19.0%301910.5%+ 81.9%506079Hyundai Santa Fe250.3%n/a97940.3%+ 64.9%9510380Mercedes V Class250.3%+ 0.0%1001040.3%+ 8.3%856281Renault Clio250.3%+ 0.0%691410.4%+ 1.4%675382Seat Ateca 250.3%+ 108.3%931060.3%+ 1.0%837383Opel Mokka240.3%+ 26.3%91910.3%+ 44.4%9810884Peugeot Partner240.3%– 22.6%109940.3%+ 141.0%9610785Audi Q7230.3%+ 187.5%781100.3%+ 323.1%7710286Suzuki Swift230.3%+ 35.3%961150.3%+ 66.7%749587Hyundai i10210.3%– 19.2%831130.3%+ 2.7%757988Mazda CX-60210.3%+ 40.0%146510.1%– 52.8%1298289Mercedes GLS210.3%+ 31.3%1041010.3%– 38.4%886990Opel Combo210.3%+ 200.0%136690.2%+ 430.8%11616891Renault Symbioz210.3%new162410.1%new148 –92Alfa Romeo Junior200.3%new51940.3%new9428093Citroen C3 Aircross200.3%+ 400.0%95440.1%+ 51.7%14112494Citroen C5 Aircross200.3%+ 233.3%170490.1%– 5.8%13413095Honda HR-V200.3%+ 33.3%661030.3%+ 35.5%8610596Peugeot 308200.3%– 37.5%711190.3%– 40.2%735497Volvo XC60200.3%– 25.9%881070.3%– 1.8%817798VW Caddy200.3%– 54.5%741220.3%– 19.7%716199Honda CR-V190.2%+ 35.7%851200.3%+ 21.2%7280100Hyundai Bayon190.2%– 53.7%731060.3%– 50.5%8250101Land Rover Defender190.2%+ 137.5%118780.2%+ 36.8%112100102Opel Astra190.2%+ 5.6%64990.3%+ 10.0%8999103Renault Austral190.2%+ 11.8%86830.2%– 35.2%10675104Audi Q5180.2%+ 200.0%120950.3%+ 97.9%9192105BMW 4 Series180.2%– 5.3%108850.2%– 3.4%10397106MG HS180.2%– 18.2%811030.3%+ 2.0%8767107Toyota BZ4X180.2%+ 800.0%251350.1%+ 118.8%161210108VW Passat180.2%+ 63.6%431680.5%+ 229.4%5688109Citroen Spacetourer170.2%+ 183.3%115610.2%+ 916.7%121155110Lexus LBX170.2%+ 183.3%105690.2%+ 475.0%115156111BMW 5 Series160.2%+ 60.0%1021100.3%+ 52.8%7878112Mazda CX-30160.2%– 5.9%76890.2%– 19.8%10076113Mazda CX-80160.2%new111750.2%new113222114Range Rover Sport160.2%+ 45.5%132630.2%– 1.6%120136115Audi A6150.2%– 42.3%82790.2%+ 58.0%110119116Renault 5150.2%new183200.1%new193 –117Seat Arona150.2%– 44.4%87840.2%– 37.8%10570118Mercedes E Class130.2%– 7.1%184520.1%– 23.5%128117119Opel Grandland130.2%+ 8.3%1311410.4%+ 281.1%66147120Ford Transit120.2%+ 100.0%160190.1%– 42.4%194199121Mercedes GLA120.2%+ 50.0%113630.2%+ 0.0%119111122Mercedes Vito120.2%+ 140.0%141330.1%+ 65.0%165177123Nissan X-Trail120.2%– 65.7%1211420.4%– 2.1%6565124Peugeot Traveller120.2%+ 100.0%125660.2%+ 633.3%118185125Renault Rafale120.2%new89960.3%new90166126BMW 1 Series110.1%+ 120.0%204320.1%+ 100.0%166184127Toyota Land Cruiser110.1%– 47.6%142600.2%+ 22.4%122109128Volvo XC40110.1%– 8.3%77800.2%+ 12.7%10998129Volvo XC90110.1%– 47.6%90930.3%– 21.2%9783130Hyundai Inster100.1%new182300.1%new169 –131Kia EV3100.1%new161500.1%new131284132Lexus RX100.1%– 50.0%164480.1%– 56.8%13784133Ssangyong Tivoli100.1%– 44.4%175350.1%– 58.3%160104134Volvo EX30100.1%+ 11.1%188230.1%– 43.9%186162135VW Crafter100.1%n/a256120.0%+ 1100.0%226310136Dacia Spring90.1%+ 800.0%240420.1%– 20.8%145172137Kia EV690.1%– 25.0%144500.1%– 31.5%132121138Mazda390.1%– 18.2%139440.1%– 20.0%142134139Mercedes CLA90.1%+ 12.5%154360.1%– 16.3%158159140Mini 90.1%+ 80.0%168370.1%+ 0.0%153163141Porsche Cayenne90.1%+ 12.5%151470.1%– 13.0%140138142Range Rover Evoque90.1%+ 80.0%194250.1%+ 92.3%180204143Skoda Enyaq Coupe90.1%+ 12.5%1141090.3%+ 43.4%80128144SsangYong Torres90.1%– 35.7%153720.2%+ 5.9%114116145Honda Jazz80.1%+ 60.0%137340.1%+ 100.0%162219146Kia Niro80.1%– 69.2%84560.2%– 37.1%124113147Mercedes A Class80.1%– 27.3%177320.1%– 11.1%167146148Mercedes CLE80.1%– 11.1%149240.1%+ 0.0%182191149Range Rover Velar80.1%n/a171260.1%+ 420.0%176226150BMW 2 Series70.1%+ 133.3%147250.1%– 46.8%177151151BMW 7 Series70.1%– 22.2%130380.1%– 22.4%150153152Cupra Leon70.1%– 41.7%122470.1%– 20.3%139131153Ford Focus Combi70.1%– 50.0%222300.1%– 44.4%168127154Honda ZR-V70.1%+ 16.7%148340.1%– 17.1%163123155Mercedes C Class70.1%+ 16.7%143420.1%+ 31.3%146170156Mercedes GLB70.1%– 41.7%117570.2%– 10.9%123115157Opel Vivaro70.1%+ 600.0%128490.1%+ 1125.0%136221158Ssangyong Rexton70.1%– 61.1%157530.1%– 5.4%127122159Subaru Crosstrek70.1%+ 0.0%180160.0%+ 6.7%208144160Suzuki Swace70.1%n/a198110.0%+ 266.7%229254161VW ID.370.1%– 36.4%167370.1%– 5.1%155167162Audi Q660.1%new210230.1%new185247163BMW X660.1%– 33.3%129420.1%– 35.4%144141164Fiat 60060.1%new126400.1%new149175165Kia Picanto60.1%– 33.3%155360.1%+ 0.0%157140166Mazda CX-560.1%– 76.0%145300.1%– 79.5%17072167Porsche 91160.1%+ 20.0%140290.1%– 19.4%173196168BMW 3 Series50.1%– 78.3%112820.2%+ 15.5%108114169BMW X250.1%– 28.6%67540.1%+ 92.9%126165170Cupra Tavascan50.1%new –60.0%new248279171Ford Capri50.1%new197120.0%new222329172Ford Transit/Tourneo Connect50.1%– 16.7%220660.2%+ 53.5%117106173Honda Civic50.1%+ 66.7%173150.0%– 37.5%211193174Hyundai Staria50.1%+ 150.0%127240.1%– 31.4%181203175Lexus ES50.1%– 50.0%152380.1%– 33.3%151139176MAN TGE50.1%+ 400.0% –80.0%+ 166.7%236283177Mitsubishi ASX50.1%– 16.7%190240.1%– 17.2%183174178Mitsubishi Outlander50.1%n/a –60.0%n/a253 –179Nissan Juke50.1%+ 400.0%178250.1%– 43.2%179137180Porsche Panamera50.1%+ 400.0%211190.1%+ 280.0%197243181Renault Kangoo50.1%– 64.3%133360.1%– 39.0%159129182Renault Megane50.1%+ 25.0%218370.1%– 19.6%154120183Subaru Outback50.1%– 73.7%124430.1%– 64.5%14374184BMW IX40.1%– 42.9%176250.1%+ 13.6%178198185BMW iX340.1%+ 0.0%234120.0%– 20.0%221227186Ford Mustang40.1%– 42.9%208120.0%+ 0.0%223197187VW ID.540.1%– 33.3%217180.0%– 43.8%200190188VW Polo40.1%– 33.3%187190.1%– 48.6%198150189Alfa Romeo Stelvio30.0%+ 0.0%191140.0%– 39.1%213201190Audi Q230.0%– 62.5%159210.1%+ 31.3%189183191BMW i430.0%– 40.0%135360.1%+ 16.1%156176192BMW i530.0%+ 0.0%195100.0%+ 66.7%230261193BMW X430.0%– 66.7%174200.1%– 42.9%192152194BMW XM30.0%+ 200.0% –90.0%– 10.0%235212195Fiat Doblo30.0%n/a172490.1%n/a135234196Fiat Panda30.0%+ 0.0%25550.0%– 50.0%257220197Kia EV930.0%– 62.5%241170.0%– 57.5%202178198Lexus RZ30.0%n/a25040.0%+ 100.0%266297199Lexus UX30.0%+ 50.0%179340.1%– 26.1%164149200Mazda230.0%– 57.1%156260.1%– 10.3%175180201Mercedes Citan30.0%– 57.1%165270.1%– 49.1%174154202Mercedes EQE30.0%– 75.0% –60.0%– 86.7%250169203Mercedes Sprinter30.0%+ 50.0%214130.0%+ 18.2%219232204Mini Aceman30.0%new26250.0%new259300205Mitsubishi Colt30.0%– 25.0%24470.0%– 36.4%245239206Porsche Macan30.0%– 70.0%203220.1%– 42.1%188160207Range Rover30.0%– 62.5%189240.1%– 29.4%184161208Renault Espace30.0%– 40.0%213150.0%+ 200.0%212209209Subaru Forester30.0%– 62.5%110480.1%+ 92.0%138195210Alfa Romeo Giulia20.0%– 50.0%21590.0%+ 80.0%234259211Audi A720.0%+ 100.0%25960.0%+ 50.0%247260212Audi Q420.0%+ 100.0%20670.0%– 61.1%238205213BMW 8 Series20.0%n/a23840.0%– 42.9%262252214BMW i720.0%+ 0.0% –20.0%– 71.4%288268215Cupra Born20.0%+ 100.0%257220.1%+ 450.0%187288216Dongfeng Box S3120.0%new212140.0%new214315217DS 720.0%– 60.0%192290.1%+ 31.8%172194218Fiat 50020.0%– 90.9%216150.0%– 88.3%21064219Ford Explorer20.0%– 50.0%181140.0%+ 7.7%215214220Ford Mustang Mach-E20.0%n/a205140.0%+ 7.7%216233221Hyundai Ioniq 520.0%– 66.7%186190.1%– 34.5%195187222Jaguar E-pace20.0%+ 100.0%26140.0%+ 100.0%265270223Jeep Compass20.0%– 60.0%134210.1%– 70.0%190133224Jeep Grand Cherokee20.0%n/a –50.0%n/a258278225Mercedes EQB20.0%– 33.3%233130.0%– 7.1%218213226Mercedes S Class20.0%– 50.0%169210.1%– 40.0%191148227Mercedes T-class20.0%new25870.0%new243285228MG 420.0%– 60.0%224180.0%+ 28.6%199188229Porsche Taycan20.0%+ 0.0%24560.0%+ 50.0%254257230Renault Arkana20.0%– 66.7%119550.2%– 43.9%125101231Renault Scenic E-Tech20.0%new –20.0%new284 –232Subaru BRZ20.0%n/a 20.0%– 80.0%285253233Suzuki Across20.0%+ 0.0% –170.0%+ 112.5%204248234Toyota Highlander20.0%– 89.5% –100.0%– 87.7%23196235Volvo EX9020.0%new –100.0%new232 –236VW ID.420.0%– 80.0%193300.1%+ 0.0%171132237VW ID.BUZZ20.0%+ 100.0%22360.0%– 45.5%256249238Audi A810.0%+ 0.0% –30.0%– 57.1%270246239Audi e-tron10.0%+ 0.0%26030.0%– 70.0%271251240BMW iX110.0%– 50.0%201110.0%– 47.6%227215241Citroen Jumpy10.0%n/a –20.0%+ 100.0%279320242DS 3 10.0%+ 0.0% –20.0%+ 100.0%281303243Fiat 500X10.0%– 85.7% –40.0%– 86.2%264189244Ford Focus10.0%n/a24360.0%– 33.3%249225245Hyundai Ioniq 6 10.0%– 83.3%202190.1%– 17.4%196216246Ineos Grenadier10.0%– 80.0%22570.0%– 53.3%239238247Jaguar F-Pace10.0%– 50.0%23570.0%– 46.2%240229248Land Rover Discovery Sport10.0%– 75.0%207160.0%+ 60.0%206224249Mazda MX-3010.0%n/a –10.0%– 66.7%296265250Mercedes AMG GT10.0%– 50.0%23070.0%– 70.8%242208251Mercedes AMG One10.0%n/a26620.0%n/a283 –252Mercedes EQA10.0%– 50.0% –120.0%– 36.8%224218253Mercedes Maybach10.0%n/a –10.0%n/a299332254MG 310.0%new103500.1%new133179255Mini Countryman10.0%– 83.3%23670.0%– 65.0%244200256Mitsubishi Eclipse Cross10.0%+ 0.0%138120.0%– 60.0%225217257Mitsubishi Space Star10.0%– 85.7% –170.0%– 41.4%203182258Nissan Ariya10.0%– 66.7%24830.0%– 66.7%275271259Peugeot 500810.0%– 87.5%228160.0%– 79.2%207118260Peugeot Rifter10.0%n/a10.0%n/a301 –261Porsche Cayman10.0%+ 0.0% 10.0%– 80.0%302286262Seat Tarraco10.0%– 94.1%185110.0%– 85.3%228125263SsangYong Actyon10.0%new –10.0%new304 –264Toyota Supra10.0%– 50.0%23930.0%– 66.7%277269265Volvo S9010.0%– 66.7%25350.0%– 16.7%260275266Volvo V9010.0%+ 0.0%25280.0%– 27.3%237266267Voyah Free10.0%new196130.0%new220305268VW Caravelle10.0%n/a10.0%n/a307 –
Source: ZAP


More Stories
2027 Maserati Updates Bring More Power, More Range, and a Sharper Edge
Maserati is heading into 2027 with a welcome round of updates that touch nearly every important part of its current...
Turkiye May 2026: Renault (+21.1%) monopolises podium in mediocre market (-22.5%)
First podium finish for the Renault Duster in Turkiye. New light vehicle sales in Turkiye crash down -22.5% year-on-year in...
China retail April 2026: Leapmotor (+52.3%), Xiaomi (+28.5%) shine in sinking market (-20.8%)
The Xiaomi SU7 is up to 2nd place overall in April. Note: March figures are also included in the data...
Porsche Taycan Sport Turismo and Cross Turismo Bow Out After Too Few Buyers Showed Up
Porsche just gave the 2027 Taycan its latest round of updates, including a larger standard battery and a new E-Shift...
Lucid Cosmos Patent Images Preview a Sleek New Electric SUV Aiming Below $50,000
Lucid’s next big move is starting to come into focus, and it could be one of the brand’s most important...
Ford’s Affordable $30,000 Electric Pickup Starts Taking Shape Ahead of 2027 Launch
Ford’s long-discussed affordable electric pickup is starting to feel a lot more real. The automaker has launched a new website...