
Ireland May 2025: VW Tiguan #1, Hyundai Inster inside Top 10
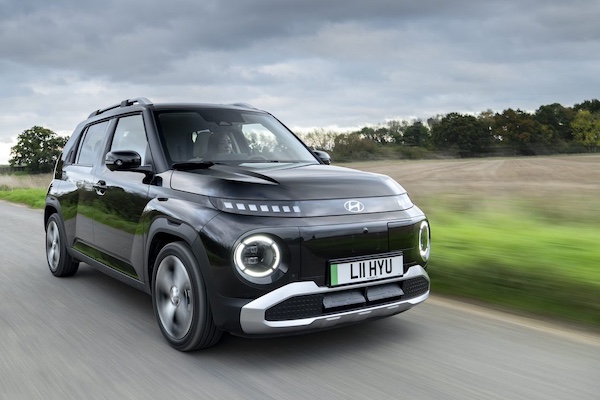
The Hyundai Inster is up to #8 in Ireland in May.
The Irish new car market is weak in May at -8.9% year-on-year to 5,832 units. However the year-to-date tally remains in positive at +2.4% to 79,301. Volkswagen (+7.9%) repeats at #1 with a formidable 15% share, but stays #2 year-to-date below Toyota (-41.7%) freefalling to #4 for the month. Hyundai (+78.9%) and Kia (+64.8%) both excel on the podium. BYD (+90%) ranks #15 in May with 2% share and #17 year-to-date with 1.7% of the market.
The Top 5 models all frankly beat the market with at least double-digit gains. The VW Tiguan (+74.2%) takes control ahead of the Kia Sportage (+14.9%) and Hyundai Tucson (+88.3%), making the podium 100% SUV. The VW Polo (+134.7%) and Hyundai i10 (+111.1%) surge ahead to close out the Top 5, followed by the Skoda Octavia (-39.7%) in great difficulty and a euphoric VW Golf (+101.6%). The new Hyundai Inster spectacularly breaks into the Top 10 at #8, having ranked #156 in April. This is the Inster’s first Top 10 finish anywhere in the world.
Previous month: Ireland April 2025: VW Tayron breaks into Top 10
One year ago: Ireland May 2024: Dacia Sandero best-seller in declining market
Full May 2025 Top 40 All brands and Top 238 All models below.
Ireland May 2025 – brands:
PosBrandMay-25%/24Apr2025%/24PosFY241Volkswagen87615.0%+ 7.9%18,93211.3%+ 7.3%222Hyundai73012.5%+ 78.9%57,6509.6%+ 7.9%343Kia5579.6%+ 64.8%46,2157.8%+ 11.7%554Toyota4658.0%– 41.7%311,27514.2%– 1.8%115Skoda4527.8%+ 4.1%27,4039.3%– 7.7%436BMW3315.7%+ 3.1%63,2674.1%+ 9.3%687Ford2935.0%– 3.6%82,8243.6%– 1.5%1198Audi2354.0%– 8.2%72,9963.8%– 13.2%869Dacia2003.4%– 48.5%102,4533.1%– 4.3%121110Mercedes1843.2%– 3.7%111,8012.3%– 11.5%131311Seat1672.9%– 19.3%171,6232.0%– 16.3%151512Peugeot1302.2%– 17.2%122,9333.7%+ 1.1%101013Volvo1242.1%– 20.0%161,2441.6%+ 6.5%181814Suzuki1142.0%– 4.2%141,6592.1%+ 17.3%141715BYD1142.0%+ 90.0%131,3471.7%+ 48.2%171916Renault1101.9%– 25.7%92,9443.7%+ 28.2%91217Opel961.6%– 52.0%191,5492.0%– 12.4%161618Tesla911.6%– 61.6%269941.3%– 8.8%211419MG681.2%+ 36.0%189311.2%+ 29.8%222320Fiat611.0%– 47.4%244500.6%+ 16.6%272621Land Rover591.0%+ 47.5%216020.8%– 8.0%252522Citroen571.0%– 10.9%226430.8%– 15.4%242223Lexus561.0%– 16.4%208111.0%+ 39.1%232424Cupra550.9%– 32.1%151,1801.5%+ 28.1%192025Nissan410.7%– 81.9%233,1914.0%– 20.2%7726Porsche360.6%+ 100.0%292890.4%+ 31.4%282827Mini350.6%+ 25.0%254510.6%+ 80.4%262728Jeep250.4%+ 525.0%301120.1%+ 49.3%303229Mazda190.3%– 80.4%271,0211.3%+ 15.0%202130Honda190.3%+ 35.7%282550.3%+ 138.3%293031Polestar90.2%– 67.9%34590.1%– 44.3%332932Xpeng80.1%new33750.1%new32 –33SsangYong50.1%– 44.4%31300.0%+ 3.4%343434Alpine50.1%n/a3790.0%+ 200.0%374235Alfa Romeo20.0%+ 100.0%36280.0%– 24.3%363636DS10.0%– 83.3%321080.1%+ 22.7%313137Smart10.0%– 87.5%35290.0%+ 52.6%353738Maxus10.0%n/a –10.0%n/a44 –39Jaguar00.0%– 100.0% –60.0%– 87.0%383340Subaru00.0%n/a3860.0%– 45.5%3938
Ireland May 2025 – models:
PosModelMay-25%/24Apr2025%/24PosFY241VW Tiguan2093.6%+ 74.2%41,7162.2%+ 16.7%862Kia Sportage2003.4%+ 14.9%32,3072.9%– 8.7%433Hyundai Tucson1943.3%+ 88.3%23,3134.2%– 2.0%114VW Polo1692.9%+ 134.7%71,0421.3%+ 1.0%20205Hyundai i101332.3%+ 111.1%1733440.4%+ 25.1%70676Skoda Octavia1322.3%– 39.7%52,1872.8%– 29.5%527VW Golf1272.2%+ 101.6%121,5552.0%+ 4.4%10118Hyundai Inster1222.1%new1563000.4%new76 –9Toyota Yaris Cross1091.9%– 44.9%112,3723.0%+ 13.8%3510Ford Tourneo1081.9%+ 2060.0%592110.3%+ 955.0%10117811Toyota RAV4941.6%– 33.3%12,4003.0%+ 5.1%2412Dacia Sandero891.5%– 68.7%361,0521.3%– 18.3%191313Ford Kuga891.5%– 39.5%296480.8%– 26.0%322714VW T-Roc861.5%– 32.8%101,2341.6%+ 8.7%151515Hyundai Kona851.5%– 50.0%91,7142.2%+ 4.9%9816Toyota Corolla851.5%– 49.7%161,8232.3%– 8.5%6717Hyundai i20761.3%+ 162.1%608091.0%– 6.4%242218VW Tayron761.3%new84420.6%new54 –19Skoda Kodiaq741.3%+ 174.1%61,7972.3%+ 41.6%7920VW Taigo741.3%+ 117.6%453700.5%+ 57.4%679621BYD Seal U731.3%new486980.9%new2818222Dacia Duster701.2%+ 11.1%149811.2%+ 8.5%212423Kia Sorento671.1%+ 63.4%306090.8%+ 69.6%394124Skoda Karoq661.1%+ 100.0%138991.1%– 5.6%232325VW ID.4641.1%– 68.9%241,1541.5%+ 37.4%172126BMW X3621.1%+ 72.2%493770.5%+ 29.1%657727BMW X1591.0%+ 227.8%374640.6%+ 39.3%496828Toyota Corolla Cross591.0%– 19.2%191,3461.7%+ 1.8%131429Hyundai Ioniq 5571.0%+ 171.4%822760.3%– 9.2%867330Kia Ceed571.0%+ 200.0%654550.6%– 25.5%503631Seat Arona571.0%+ 83.9%575830.7%– 8.0%413432Kia EV3550.9%new467370.9%new2622133Kia Stonic550.9%+ 61.8%434460.6%– 2.6%514434Toyota Yaris540.9%– 41.9%171,3501.7%– 18.0%121035Tesla Model Y530.9%– 76.8%902960.4%– 50.6%782636Volvo XC60520.9%– 42.9%1194070.5%– 1.7%585237BMW 5-Series510.9%– 17.7%186450.8%+ 0.3%333738Kia Niro450.8%+ 45.2%336160.8%– 15.7%373039Skoda Superb450.8%+ 150.0%206290.8%– 4.3%363540Opel Mokka440.8%+ 158.8%704210.5%– 15.1%575041Seat Ateca440.8%– 39.7%683850.5%+ 12.2%636342Ford Puma430.7%– 42.7%259361.2%– 10.5%221943Kia EV6430.7%+ 168.8%536140.8%+ 50.1%384744Suzuki Swift410.7%+ 64.0%284920.6%+ 101.6%466145Toyota C-HR410.7%– 43.8%311,3531.7%– 4.3%111246Peugeot 3008400.7%– 24.5%271,1701.5%+ 48.9%162547Seat Leon390.7%+ 457.1%1261860.2%+ 69.1%10911948Skoda Kamiq390.7%+ 0.0%564670.6%– 30.8%483249Audi A3380.7%+ 31.0%265520.7%+ 6.2%433950Audi A6380.7%+ 2.7%344690.6%+ 2.0%474851Peugeot 5008380.7%+ 533.3%587370.9%+ 20.0%274052Tesla Model 3380.7%+ 322.2%1806980.9%+ 42.2%291853Suzuki SX4 S-Cross370.6%+ 8.8%516730.8%+ 76.2%307054Fiat Panda350.6%– 56.8%1042390.3%+ 3.0%9310055BMW IX1330.6%+ 0.0%442220.3%– 19.0%989256Skoda Elroq330.6%new351910.2%new107 –57Audi Q5320.5%+ 10.3%522540.3%+ 17.1%917958BMW X5320.5%– 48.4%396640.8%+ 122.1%315959Renault Captur320.5%+ 77.8%227921.0%+ 72.9%254360Range Rover Sport310.5%+ 82.4%792580.3%– 18.6%908261Skoda Fabia310.5%– 56.9%215540.7%– 1.2%424262Audi A5290.5%+ 31.8%424250.5%+ 110.4%5611363Ford Focus290.5%– 56.7%386340.8%– 24.3%352864Skoda Enyaq280.5%+ 180.0%503900.5%– 14.8%626565Suzuki Vitara280.5%– 30.0%694010.5%– 25.3%605166VW ID.3280.5%+ 100.0%623560.4%– 22.8%686067Hyundai i30250.4%+ 733.3%1421500.2%– 5.7%12112268MG ZS250.4%+ 316.7%932470.3%+ 88.5%9212569Dacia Bigster240.4%new72600.1%new170 –70Jeep Avenger240.4%+ 700.0%133850.1%+ 97.7%15217071Lexus LBX240.4%+ 41.2%942700.3%+ 134.8%949872Mercedes EQE SUV240.4%+ 2300.0%161960.1%+ 29.7%14114873Renault Arkana240.4%+ 700.0%155190.7%– 35.8%453174Audi Q7230.4%n/a1151570.2%+ 361.8%11815175Mini Cooper230.4%+ 130.0%1213040.4%+ 201.0%7414976Peugeot 2008230.4%– 28.1%614360.5%– 37.6%553377Hyundai Santa Fe220.4%n/a1024060.5%+ 1745.5%5911278Volvo XC40220.4%+ 633.3%85990.1%– 49.5%14010979Audi Q4210.4%– 22.2%1181320.2%– 59.5%1267480Citroen Berlingo210.4%+ 5.0%1141200.2%– 7.7%12911181Fiat 500210.4%– 36.4%1631260.2%+ 17.8%12713382Kia Picanto210.4%+ 40.0%872860.4%– 4.3%857283BMW 3-Series200.3%– 59.2%951910.2%– 50.9%1055884Mercedes GLB200.3%+ 25.0%1741480.2%+ 66.3%12212985Opel Grandland X200.3%+ 81.8%893300.4%+ 52.8%7310586Volvo XC90200.3%– 9.1%742680.3%– 9.5%878387MG HS190.3%n/a1091420.2%+ 317.6%12419988Renault Clio190.3%– 83.0%1473830.5%– 12.2%645489Lexus NX180.3%– 41.9%732950.4%+ 23.9%799490Nissan Qashqai180.3%– 81.8%1071,2561.6%– 23.5%141691BMW 2-Series170.3%+ 88.9%671690.2%+ 11.2%11410792Mercedes GLA170.3%– 34.6%762650.3%– 9.6%897893Cupra Formentor160.3%– 27.3%473970.5%– 3.2%615694Mercedes C Class160.3%+ 300.0%631630.2%+ 162.9%11615295Mercedes CLA160.3%– 5.9%1201860.2%– 23.5%1089096Mercedes E Class160.3%– 76.1%983480.4%– 2.2%696697Mercedes GLC160.3%– 20.0%642900.4%+ 5.1%818898MG4160.3%– 36.0%553760.5%– 20.8%665799Seat Altea160.3%n/a192250.0%– 10.7%205 –100Volvo EX30160.3%– 55.6%812900.4%+ 56.8%8295101VW T-Cross160.3%– 76.1%236350.8%+ 20.0%3438102Cupra Born150.3%– 64.3%1271760.2%– 14.6%112106103Nissan Ariya150.3%+ 650.0%1511820.2%+ 19.7%110115104BYD Sealion140.2%new32930.1%new143 –105Dacia Jogger140.2%– 65.9%862870.4%– 23.1%8462106Kia EV9140.2%+ 75.0%881450.2%– 15.2%123103107Mercedes GLE140.2%+ 100.0%137930.1%– 41.1%144117108Opel Astra140.2%+ 16.7%1162280.3%– 10.6%9589109Porsche Cayenne140.2%– 6.7%1361120.1%– 15.8%135126110Opel Combo130.2%n/a139520.1%+ 940.0%176248111Peugeot 208130.2%– 23.5%1323420.4%+ 26.7%7286112Audi Q3120.2%– 76.5%405460.7%– 24.9%4429113Citroen C5 Aircross120.2%+ 100.0%992220.3%+ 22.7%99110114Ford Explorer120.2%new842650.3%new88167115Land Rover Defender120.2%+ 500.0%125830.1%– 17.8%154138116Toyota bZ4X120.2%– 40.0%662950.4%+ 40.5%8087117Audi Q2110.2%+ 10.0%1081410.2%– 15.1%125116118BMW i5110.2%+ 266.7%178500.1%+ 28.2%178181119Cupra Leon110.2%+ 57.1%771990.3%– 16.4%10391120Porsche Macan110.2%n/a146860.1%n/a151208121Renault 5110.2%new54920.1%new145 –122Seat Ibiza110.2%– 79.6%784440.6%+ 3.5%5255123Audi Q6 e-tron100.2%new1301020.1%new138214124BYD Seal100.2%– 63.0%752890.4%– 37.2%8349125Citroen C4100.2%– 28.6%1001750.2%+ 2.3%113121126Mercedes A Class100.2%n/a1291140.1%+ 500.0%134207127Audi A190.2%+ 12.5%1061100.1%– 6.0%136128128Audi Q890.2%n/a124770.1%+ 156.7%156173129BMW IX290.2%+ 350.0%190250.0%+ 1150.0%203211130BYD Atto 390.2%– 62.5%921910.2%– 29.0%10684131Cupra Terramar90.2%new801660.2%new115 –132VW ID.790.2%– 76.3%1102260.3%+ 94.8%97104133VW T790.2%+ 28.6%117600.1%+ 122.2%171195134BMW 1-Series80.1%+ 100.0%711550.2%+ 11.5%120124135BMW i480.1%+ 60.0%105960.1%– 29.4%150123136BYD Dolphin80.1%– 11.1%138760.1%– 57.8%156101137Hyundai Bayon80.1%+ 0.0%1112120.3%– 25.9%10081138Hyundai Ioniq 680.1%– 27.3%1011260.2%– 22.2%128118139Mercedes EQS SUV80.1%n/a –350.0%+ 169.2%189216140Polestar 480.1%new –210.0%new208196141Toyota Aygo X80.1%– 69.2%832080.3%– 31.1%10280142Volvo EX4080.1%new91910.1%new146 –143Xpeng G680.1%new171750.1%new157 –144Ford Capri70.1%new187650.1%new167 –145Honda HR-V70.1%n/a170880.1%n/a147229146Lexus RX70.1%– 41.7%97880.1%– 16.2%148141147Mercedes CLE Coupe70.1%– 41.7%1121160.1%+ 18.4%132135148Peugeot Rifter70.1%– 68.2%135540.1%– 36.5%175142149Porsche Panamera70.1%n/a216490.1%+ 226.7%179177150Range Rover Evoque70.1%+ 0.0%165560.1%+ 7.7%172168151Renault Scenic70.1%+ 75.0%1281590.2%+ 3875.0%117174152Renault Symbioz70.1%new1455990.8%new40175153Lexus ES60.1%+ 20.0%164850.1%– 3.4%153140154Range Rover 60.1%– 33.3%961160.1%+ 39.8%133139155Suzuki Ignis60.1%– 66.7%134740.1%– 67.8%16197156Alpine A11050.1%n/a21990.0%+ 200.0%237269156Honda Jazz50.1%+ 66.7%143740.1%+ 184.6%158165157MG350.1%– 16.7%1131170.1%+ 1850.0%131161158Mini Countryman50.1%– 54.5%162740.1%+ 39.6%159144159Nissan Juke50.1%– 95.4%1031,1091.4%– 32.2%1817160Renault Rafale50.1%new215610.1%new169184161VW ID.550.1%– 44.4%148740.1%+ 2.8%162150162BMW iX40.1%+ 0.0%214140.0%– 65.0%225206163BMW iX340.1%– 60.0%220230.0%– 74.4%206127164Citroen C5 X40.1%+ 300.0%141290.0%– 37.0%197179165Fiat 60040.1%+ 100.0%157650.1%+ 3150.0%166186166Mazda CX-540.1%– 20.0%1531770.2%– 11.5%11199167Mazda MX-3040.1%n/a217390.0%+ 254.5%184204168Mercedes EQS40.1%n/a –110.0%+ 37.5%234230169Mini Convertible40.1%+ 33.3%211130.0%– 76.4%230180170Peugeot 30840.1%– 66.7%152550.1%– 47.6%174131171Skoda Scala40.1%– 75.0%412960.4%– 14.0%7771172Volvo EX9040.1%new159340.0%new191272173VW ID.Buzz40.1%+ 0.0%205180.0%– 18.2%217153174BMW X230.1%– 50.0%176190.0%– 36.7%212183175BMW XM30.1%– 50.0%169380.0%+ 245.5%185228176Citroen E-C4 X30.1%n/a232420.1%+ 10.5%182185177Citroen Multispace30.1%n/a –30.0%n/a267 –178Cupra Tavascan30.1%new1221950.2%new104240179Dacia Spring30.1%n/a156730.1%n/a163256180Honda Civic30.1%– 25.0%184510.1%+ 41.7%177172181Mazda CX-8030.1%new172670.1%new165234182Mercedes EQE30.1%– 57.1%199300.0%– 77.6%196134183Mercedes S Class30.1%– 25.0%196280.0%– 26.3%199190184Nissan X-Trail30.1%– 78.6%1503430.4%+ 1.8%7175185Opel Corsa30.1%– 98.0%1404430.6%– 24.0%5345186Peugeot 50830.1%+ 50.0%223170.0%– 66.0%219159187Renault Megane30.1%– 50.0%1811070.1%– 39.5%137108188Ssangyong Korando30.1%– 57.1%23190.0%– 55.0%238202189Toyota Prius30.1%n/a183940.1%– 3.1%142137190Audi A720.0%+ 100.0%213160.0%– 27.3%221194191BMW 4-Series20.0%– 33.3%166450.1%– 4.3%181169192BMW Z420.0%+ 0.0%23960.0%+ 200.0%245249193Citroen C120.0%n/a –30.0%n/a261 –194Honda CR-V20.0%– 66.7%149250.0%– 3.8%204188195Honda ZR-V20.0%new233170.0%new218220196Land Rover Discovery Sport20.0%+ 0.0%123650.1%– 7.1%168156197Mazda CX-3020.0%– 66.7%1941570.2%+ 12.9%119120198Mazda CX-6020.0%n/a182870.1%– 23.0%149130199Mazda MX-520.0%– 60.0%212260.0%+ 44.4%202201200Mazda320.0%– 50.0%208820.1%– 14.6%155143201Mercedes AMG GT20.0%+ 0.0%188290.0%+ 222.2%198218202Mercedes EQA20.0%n/a224320.0%– 33.3%193171203Mercedes EQB20.0%+ 0.0%177350.0%– 58.8%188147204MG Cyberster20.0%new –80.0%new239 –205Mini Aceman20.0%new158320.0%new195 –206Peugeot 40820.0%– 84.6%1541200.2%– 57.6%13093207Porsche 911/Carrera20.0%+ 100.0%227200.0%+ 53.8%211231208Porsche Taycan20.0%+ 0.0%204220.0%– 60.7%207162209Renault Austral20.0%– 60.0%2012280.3%– 41.4%9664210Ssangyong Torres20.0%+ 0.0%160190.0%+ 850.0%214241211Suzuki Swace20.0%+ 0.0% –190.0%– 9.5%215189212Volvo C4020.0%– 33.3%168380.0%– 40.6%186155213Alfa Romeo Giulia10.0%n/a –70.0%– 30.0%240236214Alfa Romeo Junior10.0%new23670.0%new241 –215Audi A810.0%– 50.0%22870.0%– 30.0%244233216BMW 7 Series10.0%– 50.0%209270.0%– 22.9%201192217BMW X410.0%– 50.0%235110.0%– 8.3%233232218BMW X610.0%– 50.0% –30.0%– 40.0%260247219Citroen C310.0%– 95.0% –40.0%– 95.5%253145220Citroen Spacetourer10.0%n/a –40.0%– 66.7%254225221Cupra Ateca10.0%– 90.0%197470.1%– 29.9%180154222DS 710.0%– 83.3%167670.1%+ 6.3%164156223Fiat Tipo10.0%n/a144130.0%+ 225.0%229242224Ford Transit Custom10.0%+ 0.0% –150.0%+ 400.0%222253225Jeep Compass10.0%+ 0.0%186100.0%– 37.5%235203226Lexus UX10.0%– 50.0%131550.1%+ 48.6%173176227Maxus Mifa10.0%new –10.0%new283 –228Mercedes GLE Coupe10.0%n/a24030.0%n/a262 –229Mercedes GLS10.0%n/a –30.0%– 40.0%263243230Mercedes T class10.0%new23860.0%new248245231Mercedes V Class10.0%– 83.3%155320.0%+ 33.3%194193232MG510.0%– 92.3%175410.1%– 42.3%183136233Mini Clubman10.0%– 66.7%185280.0%– 30.0%200160234Opel Crossland X10.0%– 83.3%203740.1%– 64.9%160102235Opel Vivaro10.0%+ 0.0% –10.0%– 50.0%284 –236Polestar 310.0%new24130.0%new264212237Range Rover Velar10.0%– 50.0%225180.0%– 14.3%216187238Smart #110.0%– 50.0%206140.0%+ 7.7%227227
Source: SIMI


More Stories
2026 Honda Civic Invoice Price, Dealer Cost, and How to Get the Best Deal Near You
If you are shopping for a 2026 Honda Civic and want to know what dealers are actually paying, what a...
Jeep’s World Cup Wrangler Giveaway Has a Hilarious George Washington Catch
Jeep has never been shy about leaning into its American roots, and its latest World Cup campaign might be one...
2027 Jeep Wrangler Sarge Brings Willys Military Heritage Back With Modern Trail Capability
Jeep is reaching deep into its own history for the latest entry in its Twelve 4 Twelve Wrangler series, and...
How a Personal Injury Lawyer Proves Fault and Wins Your Claim
Winning a personal injury claim isn’t just about proving that you were hurt. You have to demonstrate that your injuries...
What to Do After a Car Accident That’s Not Your Fault (Step-by-Step Guide)
The first few minutes after a crash can feel strangely unreal. One moment you’re driving, the next you’re on the...
BMW Concept M Neue Klasse Previews a Wild Electric M3 Future
BMW M has officially stepped into its next chapter, and it is doing so with the kind of visual drama...