
Italy May 2025: Jeep Avenger repeats at #2, Peugeot 208 up to record #3
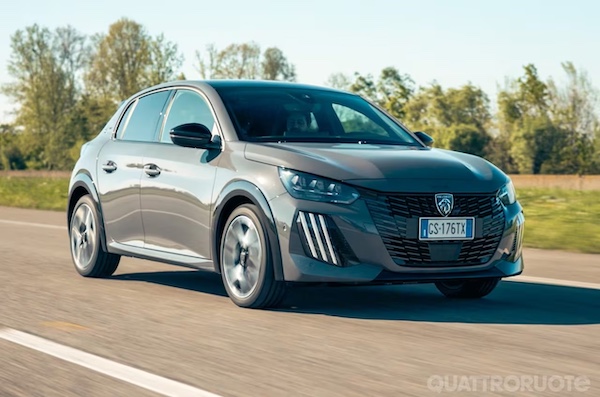
First Italian podium finish for the Peugeot 208.
Stable result for new car sales in Italy in May at -0.2% year-on-year to 139,390 units. The year-to-date is also almost immobile when compared with last year at -0.5% to 722,452. In terms of sales by channel, private sales are at -4% to 49.6% share vs. 51.3% last year (51.8% vs. 54% YTD), self registrations are down -6.9% to 11.8% share vs. 12.6% in May 2024 (8.6% vs. 10.6% YTD), long term leases gain +3.5% to 23.4% share vs. 22.4% a year ago (24% vs. 21.2% YTD), short term rentals soar 14.1% to 9.3% share vs. 8.1% (9.2% vs. 8.8% YTD) and company sales are up 4.7% to 6% share vs. 5.7% (5.6% vs. 5.5% YTD).
Looking at power sources, petrol is down -19.4% to 25.9% share vs. 31.9% a year ago (26.6% vs. 31% YTD), diesel is off -32% to 9.9% share vs. 14.5% (9.8% vs. 14.9% YTD), LPG soars 34.3% to 9% share vs. 6.6% (8.9% vs. 8.9% YTD) and HEVs gain 8.4% to 43.7% vs. 40.1% (44.6% vs. 38.9% YTD). Full hybrids are up 12.6% to 12.8% share vs. 11.3% a year ago (12.5% vs. 10.7% YTD) and mild hybrids are up 6.7% to 30.9% share vs. 28.8% last year (32.1% vs. 28.2% YTD). PHEVs shoot up 94% to 6.4% share vs. 3.3% (4.9% vs. 3.2% YTD) and BEVs surge 41.1% to 5.1% share vs. 3.6% in May 2024 (5.1% vs. 2.9% YTD).
The Jeep Avenger repeats at record 2nd place.
Fiat (-7.9%) continues to see its share fall month after month: it started the year at 11.9%, then 10.7% in February, 9.7% in March, 8.8% in April and 8.6% this month. Fiat is penalised by terrible mistake (soon to be corrected) of only offering the Fiat 500 as a BEV (124 sales this month), also we are still waiting for the new Grande Panda to crack the Top 50. Less than 100 sales below is Toyota (-0.8%), with Volkswagen (-6.4%) rounding out the podium. Peugeot (+31.5%) and Dacia (+67.8%) both lodge fantastic gains to close out the Top 5. Ford (+9.7%) and BMW (+6.5%) are the only additional gainers in the Top 10, with Jeep (-10.1%), Audi (-7.6%) and Renault (-5.6%) all losing significant ground. Below, Cupra (+47%), Alfa Romeo (+24%), Skoda (+16.2%) and MG (+16.1%) make themselves noticed, with BYD (+3640.4%) and Omoda+Jaecoo (+4840%) still gearing up.
The Fiat Panda (-6.9%) endures its lowest share so far this year at 5.9%, representing 68.7% of the carmaker’s May volume (76.7% YTD). The Jeep Avenger (+25.5%) repeats at a record 2nd place, a rank it now also holds YTD, with only 10.2% of Avenger sales going to the BEV variant. The Peugeot 208 (+62%) surges to #3, this is the nameplate’s very first incursion inside the Italian podium, its previous best being #4 in June 2022. It overtakes the Dacia Sandero (+15.1%) staying at #4 but down to #3 year-to-date. The Toyota Yaris Cross (+2.2%) and a soaring Dacia Duster (+150.2%) follow. #2 a year ago, the Citroen C3 loses -23% to #7. The Fiat 600 (+397.5%) is the manufacturer’s only ray of light, repeating at a record #11. Below, the BYD Seal U is up 8 spots on April to #23 and the Renault Symbioz up 10 to #34, both reaching new ranking records. The Lancia Ypsilon (only BEV, here too a terrible mistake) slips out of the Top 50 (-83.3%).
Previous month: Italy April 2025: Jeep Avenger breaks all records
One year ago: Italy May 2024: Negative market, Fiat hits lowest ever share, Citroen C3 up to #2
Full May 2025 Top 51 All brands and Top 50 models below.
Italy May 2025 – brands:
PosBrandMay-25%/24Apr2025%/24PosFY241Fiat11,9328.6%– 7.9%171,4499.9%– 9.2%112Toyota11,0908.0%– 0.8%355,5697.7%+ 0.8%223Volkswagen10,7527.7%– 6.4%252,6147.3%– 3.2%334Peugeot8,6356.2%+ 31.5%443,0606.0%+ 16.8%565Dacia7,8345.6%+ 67.8%546,6786.5%+ 15.9%446Renault7,7725.6%– 5.6%735,5294.9%– 2.1%657Ford6,9005.0%+ 9.7%632,2534.5%– 2.3%888BMW6,8484.9%+ 6.5%833,0234.6%+ 5.2%779Audi6,2944.5%– 7.6%1130,9824.3%– 2.4%101010Jeep5,9144.2%– 10.1%932,1974.5%– 0.8%9911Citroen5,2223.7%– 8.3%1029,5294.1%– 6.2%111112Mercedes4,7803.4%+ 0.8%1324,0703.3%+ 11.9%131213Hyundai4,3103.1%– 9.9%1421,0292.9%– 7.8%141314MG4,2993.1%+ 16.1%1225,1433.5%+ 45.5%121615Skoda3,7202.7%+ 16.2%1816,7432.3%+ 3.7%181716Opel3,5962.6%– 13.8%1518,9132.6%– 11.8%161517Kia3,4662.5%– 22.9%1619,3782.7%– 5.7%151418Suzuki2,7031.9%+ 5.0%1914,6842.0%– 12.8%191819Alfa Romeo2,4821.8%+ 24.0%1714,2492.0%+ 31.7%202120Cupra2,3331.7%+ 47.0%209,3971.3%+ 21.3%212421Nissan2,0701.5%– 32.6%2217,3782.4%– 6.0%171922DR Motor2,0231.5%+ 3.4%257,5421.0%– 4.4%232323BYD1,9451.4%+ 3640.4%217,6011.1%+ 2746.8%223724Mini1,3981.0%+ 26.6%236,4050.9%+ 6.0%242725Volvo1,1600.8%– 32.0%246,2010.9%– 30.1%252226Omoda+Jaecoo9880.7%+ 4840.0%283,9830.6%+ 31304.0%303827Mazda9560.7%– 17.3%304,7650.7%– 25.0%272628Tesla8550.6%– 20.3%354,7710.7%– 7.1%262529Honda8540.6%+ 64.9%293,9490.5%+ 19.8%313130Lancia6390.5%– 83.3%264,6490.6%– 77.4%282031Porsche6220.4%– 13.4%342,9280.4%– 29.6%333032Lexus6120.4%+ 47.5%322,9010.4%+ 40.7%343333Seat6030.4%– 57.0%274,3330.6%– 35.6%292834Land Rover5690.4%– 47.3%313,4840.5%– 24.2%322935DS5600.4%+ 16.7%332,4690.3%– 10.0%363436EVO4180.3%– 22.0%362,8320.4%+ 9.9%353237EMC2950.2%+ 178.3%381,1110.2%+ 99.1%374138Subaru2870.2%+ 82.8%391,0660.1%+ 65.8%384039Sportequipe1950.1%+ 680.0%378790.1%+ 36.9%394340Mahindra1740.1%+ 770.0%505900.1%+ 368.3%425041Maserati1400.1%– 38.6%407780.1%– 36.8%403942Mitsubishi1230.1%– 85.1%417340.1%– 65.7%413543Ferrari770.1%+ 28.3%423750.1%+ 7.1%434544Lamborghini530.0%– 5.4%452480.0%+ 10.7%454645Smart520.0%– 81.3%433520.0%– 75.9%443646Polestar320.0%+ 45.5%461560.0%+ 122.9%484947Lotus290.0%– 12.1%491220.0%– 20.3%494848Lynk & Co250.0%– 82.1%441760.0%– 64.8%474249SsangYong150.0%– 89.7%47880.0%– 71.8%504750Jaguar110.0%– 85.3%481810.0%– 67.2%464451Aston Martin70.0%+ 40.0%51550.0%+ 25.0%5151 –Others7210.5%+ 407.7% –2,8570.4%+ 297.9% – –
Italy May 2025 – models:
PosModelMay-25%/24Apr2025%/24PosFY241Fiat Panda8,1945.9%– 6.9%154,8267.6%+ 2.6%112Jeep Avenger4,7153.4%+ 25.5%224,3903.4%+ 44.0%233Peugeot 2083,7312.7%+ 62.0%519,0342.6%+ 33.2%574Dacia Sandero3,5652.6%+ 15.1%424,0763.3%– 8.0%325Toyota Yaris Cross3,4012.4%+ 2.2%615,9522.2%– 1.6%856Dacia Duster3,3382.4%+ 150.2%817,1582.4%+ 42.9%6127Citroen C33,2332.3%– 23.0%323,3923.2%+ 8.0%448Renault Clio3,2072.3%+ 0.4%913,2131.8%– 7.8%1069Ford Puma3,0552.2%+ 35.7%1212,7771.8%– 5.4%111310Toyota Yaris3,0102.2%+ 7.9%716,4852.3%+ 11.8%7811Fiat 6002,8062.0%+ 397.5%1111,8181.6%+ 1310.3%15n/a12MG ZS2,5941.9%– 9.0%1014,6822.0%+ 13.1%91413Toyota Aygo X2,5071.8%+ 14.0%189,8661.4%+ 3.1%191914VW T-Roc2,4961.8%– 22.7%1511,8991.6%– 16.5%141115Peugeot 20082,3081.7%+ 28.1%1610,7211.5%– 7.2%161716Renault Captur2,2701.6%– 14.0%1911,9971.7%– 10.0%131017VW Tiguan2,2681.6%+ 23.9%1410,6911.5%+ 61.6%172118VW T-Cross2,0381.5%– 15.9%2110,3301.4%– 4.4%181619BMW X12,0001.4%+ 28.5%209,6611.3%+ 18.8%202020Peugeot 30081,8251.3%+ 26.4%257,8621.1%+ 46.6%243921Opel Corsa1,7441.3%– 32.5%1312,2001.7%+ 14.6%121522Audi A31,6531.2%+ 71.1%267,1921.0%+ 17.3%273723BYD Seal U1,6151.2%new315,6790.8%new34n/a24Kia Sportage1,5111.1%– 34.7%238,8031.2%– 13.8%221825Hyundai i101,3501.0%– 30.9%286,2460.9%– 10.9%302626Hyundai Tucson1,2900.9%+ 27.3%326,0640.8%+ 23.4%323627Kia Picanto1,2550.9%+ 8.8%385,7220.8%+ 26.8%333428Toyota C-HR1,2410.9%– 16.7%298,1171.1%+ 22.7%232529VW Golf1,2210.9%+ 25.5%276,9921.0%+ 29.4%283130Alfa Romeo Junior1,2150.9%new227,3181.0%new26n/a31Ford Focus1,1340.8%+ 0.8%246,1900.9%+ 3.0%313832Ford Tourneo Courier1,1320.8%+ 48.9%305,3350.7%+ 72.2%38n/a33Mercedes GLA1,1200.8%+ 1.4%435,6130.8%– 6.0%352934Renault Symbioz1,1150.8%new444,0130.6%new49n/a35BMW Serie 11,0950.8%+ 53.4%504,4720.6%+ 11.6%46n/a36Nissan Qashqai1,0870.8%– 41.0%n/a8,9811.2%– 10.7%212237VW Taigo1,0670.8%+ 55.1%414,8850.7%– 9.7%434738Skoda Fabia1,0560.8%+ 0.0%395,0780.7%+ 22.1%404539Ford Kuga1,0390.7%– 24.2%355,4050.7%– 17.9%373340Cupra Formentor1,0330.7%+ 5.1%n/an/an/an/an/a4441Skoda Kamiq1,0230.7%n/a424,9030.7%n/a414942Suzuki Swift9960.7%n/a454,6960.7%n/a444343DR 5.09500.7%– 11.3%n/a4,3620.6%n/a474844BMW X39450.7%+ 35.8%n/a3,4650.5%– 0.3%n/an/a45Audi Q29050.6%+ 93.8%49n/an/an/an/an/a46Alfa Romeo Tonale8970.6%– 39.4%335,1680.7%– 33.0%392847MG 38710.6%+ 677.7%177,3941.0%+ 5862.9%25n/a48VW Polo8630.6%– 39.2%34n/an/an/an/a3249Audi A58550.6%+ 942.7%n/a2,9650.4%+ 707.9%n/an/a50Opel Mokka8540.6%+ 75.4%n/an/an/an/an/an/an/aAudi A18520.6%– 17.3%474,2960.6%+ 22.5%48n/an/aSuzuki Vitara8360.6%+ 16.4%404,9000.7%– 4.5%4241n/aNissan Juke7690.6%– 19.9%n/a6,4820.9%+ 4.1%2935n/aAudi Q37660.5%– 69.4%375,4890.8%– 29.7%3623n/aLancia Ypsilon6390.5%– 83.3%364,6490.6%– 77.4%459n/aTesla Model Y6350.5%+ 68.0%n/a2,1530.3%– 27.3%n/an/an/aJeep Compass6010.4%– 61.4%n/a3,9130.5%– 49.6%5027n/aTesla Model 32140.2%– 68.6%n/a2,6030.4%+ 26.2%n/an/an/aFiat 5001240.1%– 92.4%n/a9050.1%– 91.3%n/a24
Source: UNRAE


More Stories
2026 Honda Civic Invoice Price, Dealer Cost, and How to Get the Best Deal Near You
If you are shopping for a 2026 Honda Civic and want to know what dealers are actually paying, what a...
Jeep’s World Cup Wrangler Giveaway Has a Hilarious George Washington Catch
Jeep has never been shy about leaning into its American roots, and its latest World Cup campaign might be one...
2027 Jeep Wrangler Sarge Brings Willys Military Heritage Back With Modern Trail Capability
Jeep is reaching deep into its own history for the latest entry in its Twelve 4 Twelve Wrangler series, and...
How a Personal Injury Lawyer Proves Fault and Wins Your Claim
Winning a personal injury claim isn’t just about proving that you were hurt. You have to demonstrate that your injuries...
What to Do After a Car Accident That’s Not Your Fault (Step-by-Step Guide)
The first few minutes after a crash can feel strangely unreal. One moment you’re driving, the next you’re on the...
BMW Concept M Neue Klasse Previews a Wild Electric M3 Future
BMW M has officially stepped into its next chapter, and it is doing so with the kind of visual drama...