
Romania May 2025: Sales collapse -32.7%
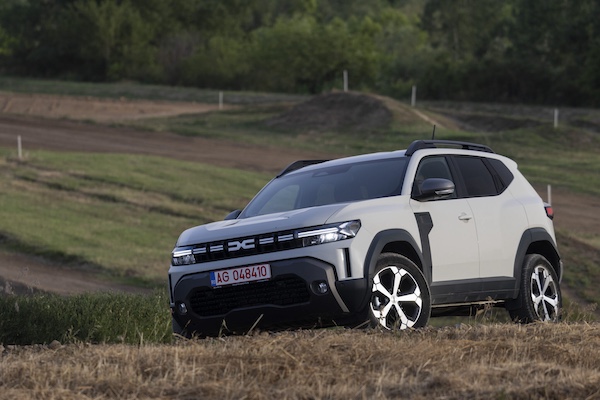
The Dacia Duster remains the most popular vehicle at home despite falling -51.5%
The Romanian new car market completely collapses in May at -32.7% year-on-year to just 10,521 sales. The year-to-date volume is now down -12.8% to 54,209. Local behemoth Dacia (-52%) completely freefalls to 25.2% share vs. 27.4% so far this year. The Top 5 is unchanged on April and YTD, with Toyota (-14.9%), Skoda (-17.7%) and Volkswagen (-16.2%) holding well but Renault (-55.7%) dives. Hyundai (-30.4%) and Ford (-36.1%) follow. Below, MG (+51.5%), BMW (+38.4%), Mercedes (+23.7%) and Ssangyong (+11.5%) go against the grain with splendid double-digit gains. Further down, Citroen (+145.9%), Cupra (+50%), Opel (+45.2%) and Peugeot (+22.8%) stand out.
In the models aisle , the Dacia Duster (-51.5%) scores a 4th consecutive monthly win and remains strong share-wise but implodes year-on-year. Likewise, the Dacia Logan (-49.6%) and Sandero (-56.9%) are both in a very bad way but still manage to control the podium. The Skoda Octavia (-15.1%) is the best of the rest at #4, distancing the Toyota Corolla (-13%) and Renault Clio (-38.9%). The Hyundai Tucson (+122.5%) ignores the market gloom and climbs back up to #7, followed by the Toyota RAV4 (+16.4%), VW Taigo (+26.5%) and Ford Kuga (+26.5%) all in splendid form.
Previous month: Romania April 2025: Market down -24.7%
One year ago: Romania May 2024: Dacia Duster tightens its grip
Full May 2025 Top 48 All brands and Top 278 All models below.
Romania May 2025 – brands:
PosBrandMay-25%/24Apr2025%/24PosFY241Dacia2,64925.2%– 52.0%114,87527.4%– 22.2%112Toyota9779.3%– 14.9%24,8809.0%– 5.1%223Skoda9098.6%– 17.7%34,3908.1%– 2.9%334Volkswagen8177.8%– 16.2%44,0127.4%+ 6.6%465Renault6316.0%– 55.7%53,2025.9%– 22.6%556Hyundai5765.5%– 30.4%72,8725.3%– 18.9%647Ford5235.0%– 36.1%92,5914.8%– 6.9%778BMW4834.6%+ 38.4%82,2204.1%+ 6.9%999Mercedes4594.4%+ 23.7%62,3114.3%+ 3.0%8810Suzuki3183.0%– 47.9%101,7403.2%– 21.9%101011MG2532.4%+ 51.5%131,1012.0%+ 141.4%121712SsangYong2332.2%+ 11.5%161,0612.0%– 4.1%141413Kia2102.0%– 39.1%111,2702.3%– 27.1%111114Audi1871.8%– 29.4%121,0742.0%– 6.4%131215Mazda1821.7%– 35.7%148911.6%– 23.0%151316Citroen1501.4%+ 145.9%185501.0%+ 11.6%172417Volvo1141.1%– 2.6%195120.9%– 6.2%181818Opel1061.0%+ 45.2%282400.4%– 32.6%232119Cupra1021.0%+ 50.0%174260.8%+ 33.1%192320Peugeot970.9%+ 22.8%158901.6%+ 5.5%161621Porsche530.5%– 5.4%252220.4%– 26.7%252722Tesla470.4%– 66.4%203370.6%– 75.3%211523Honda450.4%– 54.1%272130.4%– 44.8%262024Lexus410.4%+ 36.7%321450.3%– 2.0%303025Geely380.4%new241870.3%new274126Jeep350.3%– 57.3%223790.7%+ 47.5%202227Nissan350.3%– 75.7%262440.5%– 51.3%221928Seat320.3%– 63.6%211690.3%– 49.6%282529Mini320.3%+ 68.4%291620.3%+ 20.0%293130Land Rover310.3%– 20.5%232360.4%– 4.5%242631Fiat260.2%– 31.6%301400.3%– 44.2%312832Mitsubishi260.2%– 39.5%33880.2%– 52.2%332933Alfa Romeo190.2%+ 137.5%34870.2%+ 40.3%343234DS180.2%+ 350.0%31680.1%+ 106.1%353435Ineos180.2%n/a –210.0%+ 425.0%405036Subaru130.1%+ 160.0%35410.1%+ 57.7%373637Lamborghini70.1%+ 16.7%41180.0%– 10.0%433838Lynk & Co60.1%new39210.0%new415139Bentley50.0%+ 150.0%37340.1%+ 41.7%384040Forthing40.0%+ 300.0%38180.0%+ 100.0%424641Rolls-Royce40.0%+ 300.0%40160.0%+ 0.0%444342Ferrari30.0%– 25.0% –130.0%– 31.6%453543BAIC20.0%+ 100.0%36220.0%+ 57.1%393744DFSK10.0%– 66.7%43450.1%+ 462.5%364445Aston Martin10.0%n/a44100.0%+ 100.0%464946BYD10.0%new –40.0%new485847Cadillac10.0%– 50.0% –10.0%– 85.7%594548Westfalen10.0%new –10.0%new60 –
Romania May 2025 – models:
PosModelMay-25%/24Apr2025%/24PosFY241Dacia Duster9569.1%– 51.5%15,0299.3%– 25.0%122Dacia Logan8357.9%– 49.6%24,6358.6%– 18.3%213Dacia Sandero5024.8%– 56.9%32,8475.3%– 15.9%334Skoda Octavia3873.7%– 15.1%51,9113.5%+ 2.6%445Toyota Corolla3223.1%– 13.0%41,4362.6%+ 0.3%566Renault Clio2992.8%– 38.9%71,2032.2%+ 11.0%9117Hyundai Tucson2872.7%+ 122.5%91,3092.4%+ 41.4%678Toyota RAV42272.2%+ 16.4%81,2722.3%+ 18.4%799VW Taigo1861.8%+ 26.5%286241.2%– 8.1%191910Ford Kuga1841.7%+ 52.1%61,2122.2%+ 49.6%81311VW Golf1741.7%– 34.6%188171.5%+ 24.0%121612Toyota Yaris Cross1531.5%– 37.0%108141.5%+ 8.1%131513VW Tiguan1531.5%+ 7.0%157451.4%+ 78.7%152414Suzuki SX4 S-Cross1411.3%– 32.5%127851.4%– 8.1%142215Dacia Jogger1391.3%– 61.4%111,0561.9%– 29.2%11516Skoda Kodiaq1361.3%+ 28.3%146461.2%+ 8.2%162317Suzuki Vitara1341.3%– 52.7%196351.2%– 32.3%171818Dacia Bigster1231.2%new681910.4%new65 –19Ford Puma1231.2%– 77.4%294590.8%– 61.2%261220Mercedes GLC1111.1%+ 98.2%204810.9%+ 47.5%243821MG HS1071.0%+ 109.8%513230.6%+ 150.4%384922Ssangyong Korando1071.0%+ 48.6%225351.0%+ 9.0%203223Toyota C-HR980.9%– 36.8%273850.7%– 59.6%331724Skoda Kamiq960.9%– 24.4%263880.7%– 5.8%323625Dacia Spring940.9%– 74.6%1391,1162.1%– 40.0%10826Hyundai i30920.9%– 57.8%324680.9%– 25.8%252127Renault Austral910.9%– 54.0%402970.5%– 45.4%432728Ford Focus900.9%– 17.4%492990.6%– 43.3%423529MG ZS880.8%– 12.9%245271.0%+ 109.1%213930Renault Captur850.8%– 48.8%545221.0%+ 4.2%222831Toyota Yaris850.8%+ 51.8%384370.8%+ 64.3%274132Kia Sportage820.8%– 53.4%136251.2%– 34.6%181033VW T-Cross820.8%– 35.9%234280.8%– 1.6%282934Mazda CX-30800.8%– 4.8%213950.7%+ 27.0%314535Skoda Superb800.8%+ 233.3%563340.6%+ 79.6%365336Skoda Karoq780.7%– 32.8%353270.6%– 25.5%374237Skoda Scala740.7%– 58.0%164910.9%– 19.5%232538Mercedes GLE720.7%– 4.0%344110.8%– 20.3%303339BMW X1710.7%+ 91.9%252830.5%+ 64.5%476340Citroen C4670.6%+ 123.3%982650.5%+ 74.3%528141BMW 3 Series580.6%– 6.5%622000.4%– 41.3%605142Hyundai Kona580.6%– 46.8%364150.8%– 9.4%293143Mazda3570.5%– 6.6%372950.5%+ 26.6%445544Renault Arkana550.5%– 48.1%303190.6%– 23.3%393445Skoda Fabia530.5%– 43.6%412780.5%– 15.8%494746Opel Corsa520.5%+ 108.0%1001030.2%– 33.5%1026847Cupra Formentor510.5%+ 0.0%552310.4%+ 0.9%555248Hyundai i20500.5%– 65.8%523040.6%– 42.9%402649VW Touareg490.5%+ 8.9%393680.7%+ 62.8%345850Ssangyong Tivoli480.5%– 41.5%692800.5%– 8.5%483751BMW 1 Series470.4%+ 840.0%452270.4%+ 112.1%5611052Ford Capri460.4%new183610.1%new12834953Ford Transit Custom460.4%+ 2200.0%422850.5%+ 2092.3%4610654BMW 4 Series450.4%+ 542.9%532590.5%+ 292.4%5314355MG 3440.4%new472000.4%new6114056BMW X5420.4%– 20.8%462230.4%– 23.4%574857VW ID.4420.4%+ 250.0% –850.2%+ 66.7%11113658Citroen C3410.4%+ 105.0%861380.3%– 33.0%817959Mercedes G Class410.4%+ 95.2%871410.3%+ 17.5%798660Peugeot 308390.4%+ 225.0%941880.3%– 0.5%669361Cupra Terramar380.4%new611360.3%new8230562Tesla Model Y370.4%– 41.3%481480.3%– 69.8%774463Volvo XC60370.4%– 17.8%781680.3%– 19.2%726464Opel Mokka360.3%+ 50.0%152960.2%+ 24.7%1077865Audi A3350.3%– 28.6%432030.4%– 6.5%596766Toyota Land Cruiser 150/200350.3%+ 337.5%641670.3%+ 75.8%7314467Renault Mégane340.3%– 90.3%573370.6%– 60.7%351468Kia Niro330.3%+ 560.0% –370.1%+ 146.7%16519369Kia Xceed330.3%– 56.0%771740.3%– 25.3%706270Ssangyong Rexton330.3%+ 83.3%951200.2%– 28.1%949471Volvo XC90330.3%+ 10.0%901230.2%+ 8.8%908372Hyundai i10320.3%– 38.5%791480.3%– 24.5%766573Suzuki Swift320.3%– 51.5%582100.4%– 1.4%586974Volvo XC40320.3%+ 60.0%831190.2%+ 1.7%969775BMW X6310.3%+ 3.3%731750.3%– 13.8%686676Porsche Cayenne310.3%+ 40.9%991200.2%– 24.5%938077Mercedes GLA300.3%+ 11.1%591750.3%+ 8.7%697778VW Passat300.3%– 38.8%332710.5%+ 92.2%517379Peugeot 3008290.3%+ 314.3%502430.4%+ 105.9%548480Renault Symbioz290.3%new701290.2%new8619081Toyota Camry290.3%– 23.7%631680.3%+ 35.5%719082Mazda CX-60280.3%+ 40.0%122790.1%– 33.1%11410383Ssangyong Torres280.3%– 24.3%881070.2%– 24.6%1009184Audi Q8270.3%+ 285.7%651600.3%+ 142.4%749285BMW 5 Series270.3%+ 50.0%741460.3%+ 71.8%7810986Geely Coolray270.3%new971200.2%new9223587Renault Rafale270.3%new114970.2%new10519788Audi Q3 Sportback260.2%– 18.8%127820.2%– 38.8%1138789BMW X2260.2%+ 225.0%130770.1%+ 234.8%11516990Jeep Avenger260.2%+ 225.0%443040.6%+ 1420.0%417091Mercedes A Class260.2%+ 85.7%721020.2%+ 0.0%10311192VW Tayron260.2%new155390.1%new163 –93Audi A5250.2%+ 400.0%801300.2%+ 550.0%8520294Mercedes GLB250.2%+ 177.8%93940.2%+ 8.0%10910195Mercedes V Class250.2%+ 38.9%761410.3%+ 36.9%809896VW T-Roc250.2%– 73.1%921960.4%– 45.7%625097BMW X3240.2%– 4.0%751920.4%+ 9.7%637498Kia Ceed240.2%– 44.2%172890.5%– 12.4%455699Hyundai Bayon210.2%– 71.6%851070.2%– 66.1%9957100Mercedes C Class210.2%+ 50.0%671210.2%+ 37.5%91104101Mercedes E Class210.2%– 4.5%891230.2%+ 12.8%89100102Fiat Tipo200.2%n/a182500.1%+ 525.0%139200103Hyundai Santa Fe200.2%n/a137710.1%+ 163.0%119149104Mercedes Evito Tourer200.2%new –560.1%new134196105BMW 2 Series 190.2%+ 171.4%160490.1%– 5.8%141147106Audi A6180.2%+ 28.6%107940.2%+ 129.3%108131107Ineos Grenadier180.2%n/a –210.0%+ 425.0%186292108Nissan Qashqai180.2%– 82.4%811190.2%– 59.1%9554109VW Caddy180.2%+ 12.5%1231240.2%+ 100.0%88122110Alfa Romeo Junior170.2%new118680.1%new121275111BMW 7 Series170.2%– 15.0%108990.2%+ 19.3%104127112Mini170.2%+ 88.9%961050.2%+ 19.3%101114113Ssanyong KG Mobility Actyon170.2%new226190.0%new196 –114DS 4160.2%+ 1500.0%101430.1%+ 230.8%153250115BMW i4150.1%+ 66.7%145490.1%– 29.0%142124116Lexus NX150.1%+ 15.4%156550.1%– 6.8%135154117Audi Q5140.1%+ 75.0%136760.1%– 9.5%116102118BMW X7140.1%– 6.7%126480.1%– 53.8%145119119Honda Civic140.1%– 56.3%121710.1%– 34.9%11885120Mitsubishi ASX140.1%– 36.4%128490.1%– 16.9%143138121Audi Q7130.1%+ 62.5%601130.2%+ 334.6%98139122Honda CR-V130.1%– 60.6%157320.1%– 76.6%17676123Kia Stonic130.1%– 55.2%144570.1%– 10.9%132108124Mercedes CLA130.1%– 13.3%91960.2%+ 14.3%106121125VW Polo130.1%– 45.8%1051920.4%– 44.7%6440126Audi Q3120.1%– 50.0%1061160.2%+ 9.4%9789127Citroen C4 X120.1%+ 140.0%200200.0%– 44.4%189186128Peugeot 208120.1%– 25.0%311500.3%– 13.8%7559129Seat Arona120.1%– 45.5%66740.1%+ 13.8%117137130BMW X4110.1%– 42.1%132390.1%– 53.6%162118131Citroen Jumpy/Spacetourer110.1%n/a84590.1%+ 5800.0%130239132Geely Starray110.1%new104670.1%new123 –133Lexus RX110.1%+ 10.0%165420.1%– 19.2%156133134Mercedes CLE110.1%+ 22.2%148400.1%+ 66.7%161163135Mercedes EQA110.1%– 8.3%135420.1%– 33.3%157132136Mercedes GLS110.1%+ 83.3%166530.1%– 14.5%137128137Mini Countryman110.1%+ 22.2%154430.1%+ 4.9%154153138Nissan X-Trail110.1%– 56.0%163510.1%– 62.2%13895139Range Rover Sport110.1%+ 10.0%111850.2%+ 32.8%110120140Subaru Forester110.1%+ 450.0%150240.0%+ 300.0%183277141BMW 2 Series Tourer100.1%+ 100.0%110430.1%– 2.3%152165142Opel Astra100.1%+ 100.0%233180.0%– 25.0%200188143Seat Leon100.1%– 44.4%124410.1%– 62.4%160107144Tesla Model 3100.1%– 86.7%1201850.3%– 78.6%6720145BMW XM90.1%+ 125.0%177410.1%– 4.7%158162146Citroen C5 Aircross90.1%+ 125.0%117360.1%– 5.3%168199147Citroen C5 X90.1%n/a –90.0%+ 0.0%232296148Lexus LBX90.1%+ 350.0%149270.0%+ 1250.0%180210149Peugeot 200890.1%– 67.9%712730.5%+ 75.0%5046150VW Multivan90.1%+ 80.0%125350.1%– 2.8%172168151Ford Tourneo Courier80.1%– 33.3%142620.1%+ 31.9%127113152Honda HR-V80.1%– 65.2%116570.1%– 37.4%131105153Honda ZR-V80.1%+ 0.0%164410.1%+ 7.9%159142154Opel Grandland X80.1%+ 14.3%153230.0%– 32.4%184204155Porsche 91180.1%– 20.0%143440.1%– 2.2%151178156Seat Ateca80.1%+ 700.0%109490.1%– 29.0%144146157Toyota Proace80.1%– 33.3% –360.1%– 52.0%170157158Cupra Leon70.1%– 50.0%131420.1%– 40.0%155134159Hyudai Inster70.1%new223120.0%new217 –160Jeep Compass70.1%– 89.4%175480.1%– 74.5%14672161Kia EV970.1%n/a –70.0%+ 16.7%254282162Mazda CX-8070.1%new138550.1%new136258163Mazda270.1%– 75.0%141450.1%– 52.6%14899164MG470.1%– 46.2%199160.0%– 69.2%205125165Peugeot 40870.1%– 50.0%187210.0%– 70.0%188155166Range Rover 70.1%– 46.2%115680.1%– 16.0%122117167Cupra Tavascan60.1%new221130.0%new212337168Ford Tourneo Custom60.1%– 33.3%1131260.2%+ 366.7%87156169Kia Sorento60.1%n/a146440.1%+ 131.6%150217170Land Rover Defender60.1%– 33.3%134450.1%– 4.3%147159171Lynk & Co 0160.1%new194180.0%new198301172Mercedes S Class60.1%– 62.5%133500.1%– 43.2%140112173MG EHS60.1%+ 200.0%208330.1%+ 43.5%174189174Mitsubishi Colt60.1%+ 20.0%201130.0%– 38.1%214173175Nissan Juke60.1%– 50.0%158370.1%– 32.7%166129176Toyota Highlander60.1%– 57.1%112690.1%– 38.9%12082177Volvo EX9060.1%new249170.0%new202 –178BMW iX150.0%– 37.5%170190.0%– 45.7%192167179Fiat 60050.0%new82840.2%new112174180Ford Mustang50.0%+ 400.0%189180.0%+ 125.0%197216181Lamborghini Urus50.0%+ 400.0%181160.0%+ 45.5%204259182Porsche Macan50.0%– 64.3%176300.1%– 53.8%178152183Porsche Panamera50.0%+ 400.0%172160.0%+ 300.0%206252184Suzuki Ignis50.0%– 81.5%174360.1%– 71.0%16996185Suzuki Swace50.0%– 77.3%103660.1%– 24.1%125116186Toyota Aygo X50.0%– 89.8%151600.1%– 68.8%12975187Toyota bZ4X50.0%+ 25.0%219160.0%– 33.3%207203188Ford Explorer40.0%+ 300.0%207310.1%+ 210.0%177181189Ford Transit40.0%+ 300.0%20280.0%– 74.2%233224190Kia EV640.0%+ 100.0% –40.0%– 71.4%290241191Mercedes AMG GT40.0%– 20.0%162270.0%+ 92.9%181212192Mercedes Maybach GLS40.0%+ 33.3%205150.0%+ 87.5%208243193Mini Aceman40.0%new220140.0%new209326194Mitsubishi Outlander40.0%n/a19670.0%n/a248 –195Renault Kangoo40.0%– 42.9%129670.1%+ 131.0%124166196Renault Scenic E-Tech40.0%+ 300.0% –370.1%+ 3600.0%167195197VW Transporter40.0%n/a26550.0%n/a283 –198Audi A130.0%+ 50.0% –50.0%– 64.3%270251199Audi A730.0%+ 200.0% –70.0%– 12.5%243265200Audi Q5 Sportback30.0%– 57.1%147280.1%– 31.7%179151201Bentley Continental Flying Spur30.0%+ 200.0% –40.0%– 20.0%285322202BMW iX30.0%– 25.0%212130.0%– 53.6%211208203BMW ix230.0%n/a –30.0%+ 0.0%301276204Ford Mustang Mach-E30.0%– 50.0%179120.0%– 72.1%215171205Ford Tourneo Connect30.0%– 62.5%22890.0%– 82.7%228177206Forthing 430.0%+ 200.0%171130.0%+ 85.7%213269207Hyundai Ioniq 530.0%– 57.1%19870.0%– 93.2%245130208Hyundai Ioniq 630.0%+ 50.0%23760.0%– 71.4%262182209Hyundai Staria30.0%n/a248190.0%n/a193 –210Kia Soul30.0%n/a –30.0%+ 200.0%302387211Lexus UX30.0%+ 200.0% –80.0%– 57.9%235213212Mercedes Sprinter30.0%– 72.7%161200.0%– 53.5%190170213Mercedes T-Class30.0%+ 50.0%193100.0%+ 0.0%222253214Range Rover Velar30.0%+ 200.0%24770.0%– 30.0%249237215Renault Megane E-Tech30.0%– 76.9%1401310.2%– 18.6%8488216Skoda Enyaq30.0%– 50.0% –70.0%– 91.9%251158217Alfa Romeo Tonale20.0%– 71.4% –90.0%– 77.5%224187218Audi A820.0%+ 100.0% –60.0%+ 20.0%257289219Audi Q420.0%– 50.0% –20.0%– 92.6%318227220Audi Q620.0%new250110.0%new218306221BAIC X7520.0%n/a232100.0%+ 100.0%219246222Bentley Continental GT20.0%+ 100.0%169210.0%+ 162.5%185279223DS 7 Crossback20.0%– 33.3%167240.0%+ 33.3%182211224Ferrari Daytona SP320.0%n/a –20.0%n/a304 –225Honda Jazz20.0%+ 100.0%209120.0%+ 50.0%216236226Jeep Wrangler20.0%– 50.0%192210.0%+ 0.0%187192227Kia Proceed20.0%– 71.4%23450.0%– 75.0%275225228Lamborghini Revuelto20.0%n/a –20.0%+ 100.0%319320229Land Rover Discovery20.0%+ 100.0%25850.0%+ 25.0%276291230Lexus ES20.0%n/a –80.0%– 11.1%234260231Mazda MX-520.0%+ 100.0% –60.0%– 14.3%264215232Mercedes EQE20.0%– 71.4%168350.1%– 28.6%171150233Mercedes SL20.0%+ 100.0% –70.0%– 50.0%247242234Mitsubishi Eclipse Cross20.0%– 66.7%180190.0%– 48.6%195172235Porsche 718 Spyder20.0%+ 100.0% –30.0%+ 50.0%299315236Rolls-Royce Cullinan20.0%n/a21570.0%+ 40.0%250310237Rolls-Royce Ghost20.0%+ 100.0% –20.0%+ 0.0%320340238Seat Ibiza20.0%– 71.4%20660.0%– 57.1%266198239Skoda Elroq20.0%new19580.0%new239 –240Toyota Proace City Verso20.0%+ 0.0%23070.0%– 72.0%253185241Volvo EX3020.0%– 81.8%178570.1%+ 50.0%133123242Volvo V9020.0%+ 0.0% –50.0%– 54.5%282222243VW Crafter20.0%n/a25760.0%+ 500.0%269345244VW ID.720.0%+ 100.0% –100.0%+ 100.0%223207245Aston Martin DB1210.0%new –60.0%new256336246Audi A410.0%– 98.9%197320.1%– 89.4%17560247Audi Q210.0%+ 0.0%19190.0%– 43.8%225238248BMW Z410.0%– 50.0% –30.0%– 25.0%291298249BYD Seal10.0%new –30.0%new292370250Cadillac10.0%n/a –10.0%– 50.0%352372251Citroen e-C310.0%new218160.0%new203397252DFSK E510.0%new217440.1%new149314253Ferrari 29610.0%+ 0.0% –30.0%+ 0.0%294280254Fiat 50010.0%– 96.2%22760.0%– 97.3%26071255Ford Bronco10.0%– 50.0%25190.0%+ 28.6%227231256Forthing 510.0%n/a25450.0%+ 150.0%274343257Kia EV310.0%new –100.0%new221347258Kia Picanto10.0%– 80.0%20390.0%– 67.9%229219259Kia Rio10.0%– 66.7%22960.0%– 89.3%263160260Land Rover Discovery Sport10.0%– 50.0%21090.0%– 25.0%230220261Lexus LX10.0%+ 0.0% –10.0%+ 0.0%353403262Mazda MX-3010.0%+ 0.0% –70.0%– 53.3%246233263Mercedes EQB10.0%– 75.0%188180.0%– 37.9%199184264Mercedes EQS10.0%– 83.3%244190.0%– 24.0%194205265Mercedes Maybach EQS10.0%new –20.0%new312407266MG Cyberster10.0%new –20.0%new313 –267Peugeot 50810.0%n/a –50.0%– 95.8%279148268Porsche 718 Cayman10.0%– 66.7%24340.0%– 69.2%288255269Porsche Taycan10.0%– 50.0%25650.0%– 50.0%280261270Range Rover Evoque10.0%– 66.7%159170.0%– 41.4%201175271Subaru Outback10.0%– 50.0%21380.0%+ 0.0%240268272Subau Crosstrek 10.0%n/a18480.0%+ 166.7%241302273Suzuki Across10.0%– 66.7% –80.0%– 38.5%242245274Toyota Auris10.0%n/a –10.0%n/a355 –275Volvo EC4010.0%new25360.0%new267 –276Volvo S6010.0%– 66.7% –20.0%– 80.0%316206277VW California10.0%+ 0.0% –10.0%– 50.0%354364278VW ID.5 10.0%n/a23920.0%– 94.1%317221
Source: DRPCIV


More Stories
Malaysia May 2026: Proton Saga back in charge
The Proton Saga is the best-selling vehicle in Malaysia in May. It’s a difficult month for new car sales in...
Singapore May 2026: BYD #1, Chery inside Top 5, Chinese at 52% share
Chery is up to #4 in Singapore in May. It’s a stable result for the Singaporean new car market in...
Our Review of the London Concours 2026
Billed as “The ultimate summer party in the city: the world’s rarest cars assembled in the heart of the Square...
Dealer Invoice vs. Market Value: Finding the Best Used Cars in Troy, OH
Navigating the financial landscape of automotive retail requires an understanding of distinct valuation metrics. When researching vehicle costs online, buyers...
Our Photos from the London Concours 2026
The London Concours, held on the manicured lawns of the Honourable Artillery Company since 2017, is a MUST-ATTEND CAR SHOW....
Powerful Upgrades That Make the Lotus Emira 420 Sport Better Than Ever
Lotus has pulled the covers off what is arguably the most focused Emira yet. The Lotus Emira 420 Sport, in...