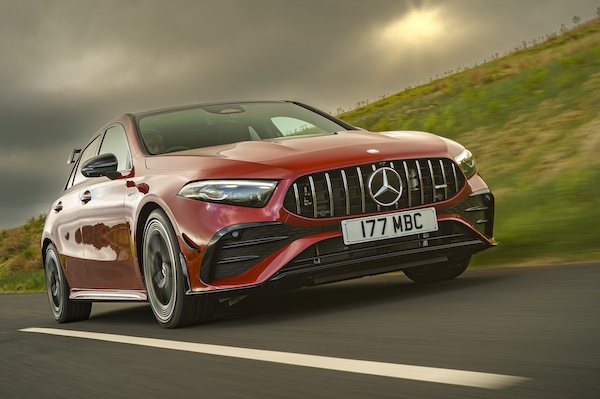
Hungary August 2024: Ford (+54.2%), Mercedes (+42%) impress
Mercedes ranks #4 in Hungary in August.
New passenger car sales in Hungary drop -9.4% year-on-year in August to 8,111 units. This is to be compared with 15,618 sales in pre-pandemic 2019 and 9,644 during the pandemic in August 2020. The year-to-date tally however remains up at +8.2% to 79,976. In the brands charts, Suzuki (+14.1%) is back above Toyota (-25%) with 13.4% of the market vs. 12.4%. Skoda (-20.6%) is back up three spots on July to #3 but is in difficulty year-on-year. Mercedes (+42%) and Ford (+54.2%) both post very satisfying gains to rank #4 and #5 respectively. Mercedes is at 7.2% share vs. 4.4% year-to-date. BMW (+16.1%) also shines at #7. All remaining Top 10 members are in decline: Nissan (-44.1%) and Volkswagen (-33.7%) are the hardest hit while Hyundai (-3.4%) and Kia (-4.2%) limit their fall. Further down, Lexus (+73.3%) and Volvo (+8.6%) stand out just as BYD drops three spots on last month to #18.
The Suzuki S-Cross (+28.1%) repeats at #1 but this is not enough to upset the Suzuki Vitara (-22.7%) in the year-to-date charts. The Vitara holds 6.3% of the market over the first 8 months of the year vs. 5.3% for the S-Cross. The Skoda Octavia (-35.1%) and Kia Ceed (-7.3%) camp on their YTD rankings while the Toyota C-HR (+61.8%), Ford Kuga (+129.7%) and Toyota Yaris Cross (+23.1%) all score splendid upticks.
Previous month: Hungary July 2024: Suzuki S-Cross best-seller
One year ago: Hungary August 2023: Skoda Octavia leads, Nissan Qashqai up to #5 in weak market
Full August 2024 Top 20 brands and models below.
Hungary August 2024 – brands:
PosBrandAug-24%/23Jul8m 2024%/23PosFY231Suzuki1,08613.4%+ 14.1%210,60813.3%+ 71.4%122Toyota1,00912.4%– 25.0%19,67112.1%– 2.5%213Skoda7118.8%– 20.6%66,6918.4%– 11.4%334Mercedes5827.2%+ 42.0%83,5314.4%+ 9.3%985Ford5697.0%+ 54.2%43,9554.9%– 14.9%666BMW4916.1%+ 16.1%73,7494.7%+ 5.8%777Volkswagen4896.0%– 33.7%36,0367.5%– 3.2%448Kia4745.8%– 4.2%54,3025.4%– 9.9%559Hyundai2573.2%– 3.4%93,6034.5%+ 44.7%81210Nissan2543.1%– 44.1%n/a3,4794.4%+ 128.3%101411Audi2352.9%– 26.6%102,1732.7%– 20.3%141112Volvo2152.7%+ 8.6%122,3502.9%+ 28.1%131313Dacia2142.6%– 15.4%142,5813.2%– 17.6%11914Opel1672.1%– 36.0%112,5593.2%– 3.6%121015Peugeot1341.7%– 40.2%131,2851.6%+ 4.8%171816SsangYong1311.6%– 32.5%181,2361.5%– 15.6%191617Lexus1301.6%+ 73.3%17n/an/an/a232218BYD1241.5%n/a15n/an/an/a21n/a19Mazda1101.4%– 32.5%201,0471.3%– 17.0%201920Renault851.0%– 43.3%192,1002.6%+ 50.9%1515n/aTesla400.5%– 65.8%n/a1,3851.7%+ 53.9%1621n/aMG360.4%– 77.8%n/a1,2491.6%+ 31.1%1820
Hungary January – August 2024 – models:
PosModelAug-24%/238m 2024%/23PosFY231Suzuki S-Cross6017.4%+ 28.1%4,1995.3%+ 36.9%212Suzuki Vitara3173.9%– 22.7%5,0026.3%+ 118.1%133Skoda Octavia3133.9%– 35.1%3,8554.8%– 3.3%324Kia Ceed2172.7%– 7.3%2,1442.7%– 9.3%455Toyota C-HR2122.6%+ 61.8%1,6332.0%+ 14.6%896Ford Kuga2092.6%+ 129.7%1,1521.4%+ 74.0%13317Toyota Yaris Cross2082.6%+ 23.1%1,4461.8%– 4.6%1078Nissan Qashqai2022.5%– 26.5%2,1242.7%+ 130.6%5209Toyota Corolla1762.2%– 56.1%2,0372.5%– 12.0%6410Dacia Duster1642.0%– 1.2%1,9612.5%+ 13.5%76n/aSuzuki Swift1461.8%+ 198.0%1,0741.3%+ 79.6%1537n/aKia Sportage1391.7%+ 24.1%1,2001.5%+ 11.8%1117n/aVW Golf1221.5%– 7.6%1,5231.9%+ 53.5%916n/aHyundai Tucson1211.5%+ 7.1%1,1901.5%+ 27.0%1224n/aToyota Yaris1201.5%– 21.1%1,1321.4%– 22.9%1412n/aFord Puma1181.5%– 23.4%9771.2%+ 15.8%1734n/aToyota Corolla Cross811.0%– 45.3%9591.2%+ 39.4%1828n/aToyota RAV4730.9%– 33.0%1,0161.3%+ 3.4%1614n/aVW Passat550.7%– 43.9%8861.1%+ 10.5%2026n/aMG ZS200.2%– 84.3%8961.1%+ 36.2%1930
Source: Datahouse. Many thanks to Csaba


