Vietnam August 2024: Mitsubishi Xforce repeats at #1, Ford Ranger now #1 YTD
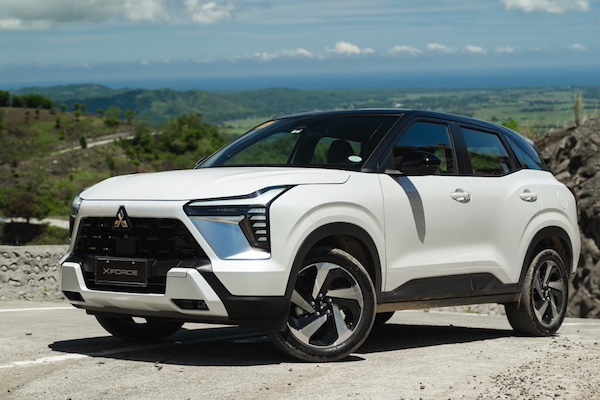
The Mitsubishi Xforce is the clear leader in Vietnam in August.
According to local association VAMA, the Vietnamese new car market is up 11.8% year-on-year in August to 25,196 sales, leading to a year-to-date tally up 15.4% to a round 189,000. These figures climb to 29,875 (+16.3%) and 223,107 (+1.5%) when adding Hyundai which reports separately.
Toyota (+19.8%) retains the brands top spot with 15.7% share but its advantage over #2 Hyundai (+48.8%) is only 21 sales. Hyundai stays at #1 year-to-date. Mitsubishi (+69.2%) posts a fantastic score and overtakes Thaco-Kia (-18.6%) to snap the third position with 13.7% share vs. 10.1% so far this year. Ford (+17%) also shines at #5.
Model-wise, the new Mitsubishi Xforce repeats at #1 but whereas last month the gap with the #2 was just 3 units, this time the Xforce sells almost double its direct follower, the Ford Ranger (+14.5%). The Ranger also snaps the year-to-date pole position in the process, dislodging the Mitsubishi Xpander (-41%) down to #5 for the month. #1 a year ago, the Mazda CX-5 (-38%) drops to #3. The Toyota Vios (+250.7%) once again catches up on a poor year-ago result and ranks #4.
Previous month: Vietnam July 2024: Mitsubishi Xforce best-seller
One year ago: Vietnam August 2023: Mazda CX-5 and Mitsubishi Xpander top freefalling market
Full August 2024 Top 16 All manufacturers and Top 66 All models below.
Vietnam August 2024 – manufacturers:
PosBrandAug-24%/23Jul2024%/23PosFY231Toyota4,70015.7%+ 19.8%133,51715.0%– 2.5%222Hyundai4,67915.7%+ 48.8%234,10715.3%– 3.1%113Mitsubishi4,09113.7%+ 69.2%422,54810.1%+ 20.0%564Thaco-Kia3,73312.5%– 18.6%330,17113.5%– 13.5%335Ford3,27010.9%+ 17.0%524,07110.8%+ 3.0%446Mazda2,5098.4%– 17.2%617,6917.9%– 12.7%657Honda1,1603.9%– 18.9%714,0476.3%+ 12.2%778Isuzu7702.6%+ 12.1%85,9502.7%+ 10.3%9109Suzuki4691.6%– 47.5%97,2053.2%– 27.6%8910Peugeot2570.9%+ 33.2%101,8710.8%+ 15.8%101111Hyundai Trucks1600.5%+ 97.5%111,4750.7%+ 105.4%111512BMW+Mini1240.4%– 37.1%121,1270.5%– 12.6%121313Hino790.3%– 37.8%131,0450.5%– 30.5%131214Lexus610.2%– 61.9%148570.4%– 19.5%141415Samco180.1%– 25.0%152210.1%+ 61.3%151616Daewoo Bus70.0%– 91.3%16350.0%– 77.0%1618
Vietnam August 2024 – models:
Note: Some manufacturers such as BMW, Lexus and Peugeot don’t share models detail.
PosModelAug-24%/23Jul2024%/23PosFY231Mitsubishi Xforce2,5048.4%new18,1423.6%new3 –2Ford Ranger1,2744.3%+ 14.5%410,2934.6%+ 4.1%143Mazda CX-51,0703.6%– 38.0%67,3843.3%– 16.2%434Toyota Vios1,0103.4%+ 250.7%26,9703.1%+ 16.5%555Mitsubishi Xpander1,0033.4%– 41.0%310,2684.6%– 16.3%216Hyundai Accent9373.1%– 6.5%76,9103.1%– 29.7%627Toyota Yaris Cross9273.1%new55,9192.7%new8348Ford Everest8122.7%+ 21.6%86,2052.8%+ 4.6%799Hyundai Creta6132.1%+ 67.5%124,1131.8%– 23.2%12710Toyota Corolla Cross5771.9%– 65.9%143,2761.5%– 64.2%16811Ford Territory5761.9%+ 13.6%114,2621.9%– 8.7%111312Ford Transit5751.9%+ 13.4%452,8571.3%+ 5.3%222613Toyota Veloz Cross5381.8%+ 6.7%94,0711.8%– 26.5%131214Hyundai Santa Fe5111.7%+ 127.1%193,1411.4%+ 2.1%201615Mazda24421.5%+ 54.5%223,2391.5%+ 25.8%182516Kia Seltos4391.5%– 54.7%173,5721.6%– 31.0%141117Kia Sonet4301.4%– 59.6%214,3411.9%– 33.5%10618Hyundai Tucson4251.4%+ 129.7%183,0341.4%+ 50.7%211819Honda City4211.4%+ 8.2%104,4812.0%– 25.8%91020Toyota Innova Cross4061.4%new332,7401.2%new246121Mazda33801.3%– 32.1%262,8161.3%– 23.8%231522Hyundai Stargazer3771.3%+ 305.4%152,1110.9%– 4.0%292723Kia Carens3661.2%+ 22.0%242,6071.2%+ 18.6%273024Hyundai Grand i103101.0%– 19.5%232,7311.2%– 42.6%251425Kia K33081.0%+ 54.0%292,1491.0%+ 10.5%283326Hyundai Venue2971.0%new302,1020.9%new306927Toyota Raize2961.0%+ 14.7%252,6561.2%– 23.5%262428Honda CR-V2911.0%– 43.9%163,2031.4%+ 6.4%191929Kia Sportage2911.0%+ 177.1%371,5180.7%– 1.9%394230Kia Carnival2800.9%– 25.9%203,2531.5%– 3.3%172131Toyota Fortuner2360.8%+ 1.7%271,7990.8%– 25.6%353132Mitsubishi Attrage2330.8%– 26.5%341,5710.7%– 50.0%382233Suzuki Carry Pro2280.8%+ 5600.0%361,8050.8%+ 45025.0%346734Mazda CX-32250.8%+ 275.0%321,4900.7%+ 48.6%414835Hyundai Custin2170.7%new411,6460.7%new374636Mitsubishi Outlander2170.7%+ 59.6%478390.4%– 37.6%504037Honda HR-V2130.7%+ 3.4%133,3291.5%+ 61.6%152838Mazda CX-82100.7%– 15.7%381,4920.7%– 20.6%403639Honda BR-V2080.7%– 17.8%282,1000.9%+ 291.8%313540Toyota Hilux2060.7%+ 1371.4%311,0530.5%+ 1124.4%467141Toyota Wigo2000.7%– 11.1%351,7170.8%+ 108.9%364542Suzuki Carry1700.6%+ 4.9%551,8730.8%– 17.3%323243Mazda CX-301400.5%+ 169.2%439440.4%+ 0.4%474744Hyundai Elantra1320.4%– 14.3%421,0800.5%– 33.9%453745Toyota Avanza Premio1290.4%– 56.4%401,2430.6%– 40.6%432946Hyundai Palisade1020.3%new467780.3%new516347Mitsubishi Triton860.3%– 47.6%391,2810.6%– 6.3%423848Toyota Camry650.2%– 52.9%448540.4%– 50.3%494149Kia Sorento620.2%+ 3.3%495640.3%– 43.3%525050Isuzu D-Max600.2%+ 185.7%572800.1%– 23.1%606251Suzuki Jimny570.2%new582610.1%new61 –52Mitsubishi Pajero Sport480.2%– 52.0%544470.2%– 32.5%555853Toyota Innova460.2%– 62.0%534340.2%– 68.4%564454Mazda6420.1%– 16.0%593210.1%– 58.0%585555Kia Morning380.1%– 47.2%564890.2%– 53.1%534956Ford Explorer330.1%n/a514540.2%+ 167.1%546557Toyota Corolla330.1%– 52.9%483190.1%– 69.8%595258Honda Civic240.1%– 61.3%528770.4%+ 4.2%485359Toyota Land Cruiser220.1%– 58.5%503740.2%+ 12.3%576060Isuzu MU-X200.1%+ 53.8%641240.1%+ 3.3%656661Kia Soluto190.1%– 76.3%612430.1%– 64.1%625662Kia K5140.0%– 82.5%601870.1%– 70.9%645763Suzuki XL7130.0%– 92.4%621,8130.8%– 3.1%333964Toyota Alphard90.0%+ 125.0%65830.0%+ 15.3%667065Honda Accord30.0%+ 50.0%67570.0%+ 83.9%677366Suzuki Super Carry Pro10.0%– 99.8%68200.0%– 99.6%6820
Source: VAMA, Hyundai

