
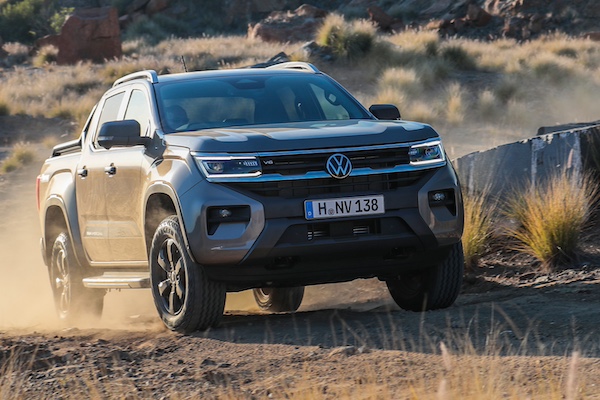
New Zealand August 2024: Volkswagen (+42.9%), Mitsubishi (+24.6%) highlight stable market
VW Amarok
The New Zealand new vehicle market edges up 2.1% year-on-year in August to 9,990 sales. This is to be compared with 14,662 in August 2022. The year-to-date tally is off a daunting -18.7% to 82,067. In August, Passenger Cars are up 6.6% to 1,412, SUVs down -5.4% to 5,327 and Light Commercials up 24.7% to 2,586. Year-to-date, Passenger Cars sink -33.5% to 10,183, SUVs fall -24.5% to 42,887 and Light Commercials gain 0.5% to 23,695.
In the brands charts, the Top 2 best-seller frankly underperform: Toyota is down -14.8% to 20.8% share vs. 21.4% so far this year and Ford drops -17.7% to 11.9% share vs. 13.7% YTD. In contrast Mitsubishi surges 24.6% but its market share remains well below its YTD level at 9.9% vs .11.2%. Volkswagen (+42.9%), Hyundai (+19.3%) and Suzuki (+17.1%) shine further down.
Model-wise, the Ford Ranger (-1.9%) easily keeps the lead of the charts with 8.3% share, distancing the Toyota Hilux (+47.7%) rallying back up to 6.9% share vs. 6.1% year-to-date. Unlike in neighbouring Australia, the Toyota RAV4 (-30%) is in great difficulty this month. The Kia Seltos (+43.9%) repeats at #4 ahead of the Mitsubishi ASX and Triton (+82.4%). The Suzuki Swift (+20.1%) and Toyota Yaris Cross (+18%) also impress in the remainder of the Top 10.
Previous month: New Zealand July 2024: Market rallies back up 52.6%
One year ago: New Zealand August 2023: Ford, Nissan again defy freefalling market (-33.1%)
Full August 2024 Top 71 All brands and Top 20 models below.
New Zealand August 2024 – brands:
PosBrandAug-24%/23Jul2024%/23PosFY231Toyota2,07720.8%– 14.8%117,55021.4%– 15.2%112Ford 1,18711.9%– 17.7%211,22813.7%+ 2.1%223Mitsubishi9929.9%+ 24.6%39,16011.2%– 2.9%334Kia8448.4%+ 5.1%45,6506.9%– 27.0%445Suzuki4514.5%+ 17.1%53,7524.6%– 27.4%566Hyundai3643.6%+ 19.3%92,7873.4%– 50.6%757Volkswagen3303.3%+ 42.9%82,2182.7%– 21.4%9118Nissan3293.3%– 11.6%73,0753.7%– 5.3%699Mazda3273.3%+ 7.2%62,4443.0%– 19.4%81010MG2983.0%+ 4.2%131,8752.3%– 44.2%13711Honda2822.8%+ 54.9%111,9982.4%– 18.3%111312Mercedes2462.5%– 2.0%141,5271.9%– 5.3%141413GWM2372.4%+ 1216.7%102,1042.6%+ 596.7%102514Isuzu1972.0%+ 28.8%121,9082.3%+ 4.5%121515Skoda1371.4%+ 93.0%227490.9%– 39.8%211816Subaru1331.3%+ 6.4%151,2561.5%– 20.2%151617Tesla1331.3%+ 27.9%208591.0%– 70.1%17818BYD1081.1%– 17.6%185320.6%– 73.9%231219Lexus860.9%– 11.3%198531.0%– 1.7%182120Audi850.9%+ 19.7%237530.9%– 16.4%202021Fuso840.8%– 9.7%266780.8%– 19.2%222222BMW820.8%– 46.1%169671.2%– 17.8%161923Land Rover780.8%– 21.2%217871.0%– 11.9%192324Scania670.7%– 10.7%304440.5%+ 3.7%263025SsangYong/KGM620.6%+ 138.5%283140.4%– 20.9%313526LDV580.6%+ 114.8%255200.6%– 39.7%252427Peugeot530.5%– 7.0%244050.5%– 41.0%282628Hino510.5%– 33.8%273900.5%– 27.4%292829Volvo Trucks500.5%+ 117.4%292740.3%+ 29.9%344130Fiat480.5%+ 50.0%314220.5%+ 37.9%272931Mini400.4%+ 53.8%175240.6%– 6.3%242732Renault400.4%+ 1233.3%361870.2%– 31.0%403933Omoda370.4%new332580.3%new35 –34Porsche360.4%+ 350.0%323600.4%+ 13.2%303635Volvo330.3%– 31.3%392750.3%– 39.0%333236Iveco320.3%– 54.9%412410.3%– 34.3%363137Cupra270.3%+ 145.5%422050.2%– 17.0%373738Mahindra240.2%+ 100.0%373110.4%+ 31.2%324239Jeep240.2%– 35.1%351660.2%– 39.0%433440Jaecoo240.2%new34750.1%new48 –41Polestar230.2%+ 15.0%48790.1%– 73.8%473342Ram220.2%+ 15.8%431800.2%– 12.6%424343Kenworth210.2%– 12.5%401940.2%+ 59.0%394644DAF180.2%– 5.3%452000.2%+ 17.6%384445UD Trucks120.1%– 68.4%461430.2%– 35.9%444046Foton120.1%+ 0.0%441100.1%– 16.7%464947Chevrolet110.1%– 35.3%381840.2%+ 15.7%414548Jaguar100.1%– 16.7%491380.2%+ 10.4%454849Opel60.1%– 76.0%47530.1%– 74.6%523850Sinotruk60.1%+ 200.0%63310.0%+ 121.4%566551MAN50.1%– 44.4%56430.1%– 60.9%555052Mack50.1%– 28.6%58240.0%– 35.1%615753Alfa Romeo40.0%– 42.9%55570.1%+ 46.2%505154Lamborghini40.0%+ 300.0%51260.0%+ 30.0%596355Citroen30.0%– 50.0%53430.1%– 65.3%534756Lotus30.0%+ 50.0% –150.0%– 37.5%656157Yamaha30.0%+ 200.0% –150.0%– 11.8%666258Haval20.0%– 96.4%50620.1%– 96.6%491759CRRC20.0%– 91.3% –530.1%+ 26.2%515860Ferrari20.0%– 75.0% –270.0%– 20.6%586061Maserati20.0%– 50.0%54260.0%– 44.7%605362Can-Am20.0%– 71.4%64170.0%– 39.3%645963Ineos10.0%– 88.9%52430.1%+ 13.2%545264Bentley10.0%– 83.3% –220.0%– 35.3%625565McLaren10.0%n/a6080.0%+ 166.7%687366Freightliner10.0%n/a6160.0%– 25.0%736967Western Star10.0%+ 0.0% –50.0%– 66.7%746668Zhongtong10.0%n/a –50.0%n/a75 –69BCI10.0%+ 0.0% –30.0%– 25.0%777070Xpeng10.0%new –20.0%new81 –71Sany10.0%n/a –10.0%+ 0.0%8583
New Zealand August 2024 – models:
PosModelAug-24%/23Jul2024%/23PosFY231Ford Ranger 8268.3%– 1.9%17,8039.5%+ 8.0%112Toyota Hilux6876.9%+ 47.7%25,0446.1%– 20.1%333Toyota RAV45415.4%– 30.0%35,1376.3%+ 0.4%224Kia Seltos3083.1%+ 43.9%42,0052.4%+ 50.3%7225Mitsubishi ASX2862.9%n/a52,2772.8%n/a5n/a6Mitsubishi Triton2792.8%+ 82.4%73,2744.0%+ 21.8%4107Suzuki Swift2572.6%+ 20.1%61,9502.4%– 33.3%868Mitsubishi Outlander2212.2%– 31.2%82,1642.6%– 7.8%649Toyota Yaris Cross1901.9%+ 18.0%n/a8581.0%n/a221110Kia Sportage1781.8%n/a131,1101.4%n/a13n/a11Kia Stonic1691.7%– 12.0%n/a1,2041.5%– 14.1%122112Mitsubishi Eclipse Cross1541.5%– 33.9%171,0821.3%– 56.5%14713Nissan Navara1421.4%+ 82.1%91,4091.7%+ 45.1%9n/a14Toyota Yaris1361.4%– 13.4%n/an/an/an/an/an/a15Honda HR-V1261.3%n/an/an/an/an/an/an/a16Mazda CX-51231.2%+ 4.2%141,0121.2%– 17.2%172317MG ZS1191.2%– 11.9%n/a1,0341.3%– 58.1%16918MG 31191.2%n/a22n/an/an/an/an/a19Toyota Highlander1181.2%– 35.2%169991.2%n/a18n/a20Ford Transit1051.1%+ 50.0%191,0461.3%+ 58.2%15n/an/aToyota Hiace1031.0%– 32.2%101,2991.6%+ 1.0%1018n/aIsuzu D-Max1021.0%+ 148.8%119911.2%+ 12.5%19n/an/aMercedes Sprinter930.9%– 5.1%n/an/an/an/an/an/an/aToyota Corolla900.9%– 47.7%128621.1%– 26.5%2112n/aFord Everest790.8%– 65.0%151,2801.6%n/a1119n/aToyota Corolla Cross380.4%n/an/a8931.1%n/a2017
Source: MIA

More Stories
Sensational Classic Nostalgia 2026 Ticket Competition Winners Revealed
The celebrated Classic Nostalgia 2026 is almost here. Taking place at the historic Shelsley Walsh Hill Climb on 18-19 July...
China new models June 2026: BYD Great Tang and Leapmotor D99 land
BYD Great Tang Now that June 2026 has been studied, let’s focus on the latest launches on the Chinese market....
Range Rover Sport Electric Previewed as Land Rover’s Next Performance EV SUV
Land Rover is preparing to add a fully electric version of the Range Rover Sport to its lineup, giving one...
Canada June/Q2 2026: Toyota(+12%), Volkswagen (+26.2%) stand out
VW Tiguan sales triple year-on-year over Q2. According to local consultancy DesRosiers Automotive, new light vehicles sales in June end...
Belgium June/H1 2026: Fleet BEVs at 59% share, Mercedes CLA and BMW iX3 stun
The BMW iX3 is an instant blockbuster in Belgium. The Belgian new car market is up by a solid 9.4%...
Incredible Reasons to Visit Classic Nostalgia 2026 at Shelsley Walsh
Classic Nostalgia 2026 is nearly here, and anticipation continues to grow. On 18–19 July, the historic Shelsley Walsh Hill Climb...