Finland August 2024: Toyota Yaris Cross repeats at #1, Opel Astra up to #5
The Opel Astra hits its highest Finnish ranking in 4.5 years.
The Finnish new car market remains in hell in August at -16.7% year-on-year to just 6,389 sales. The year-to-date tally is now off -17.2% or over 10,000 units to 49,714. Toyota (-8.9%) maintains its grip on the brands charts but sees its market share thaw to 16.1% vs. 19.1% year-to-date. Volvo (+22.8%) defies the negative context but at 9.6% share it is well below its YTD level of 11.2%. If Volkswagen (-10.2%) manages to keep its loss below the market rate, it is not the case for Kia (-23.7%) and Skoda (-24.2%). Hyundai (+19.3%) is the only remaining Top 10 member in positive just as Ford (-1.6%) is stable at #10 but Mercedes (-26.6%), BMW (-44.6%) and Tesla (-45.5%) all implode. Below, Subaru (+780%), Opel (+227.1%), BYD (+182.3%) and Renault (+130%) shoot up.
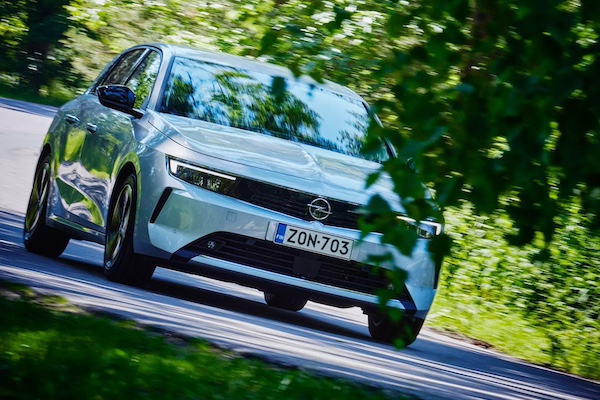
Model-wise, the Toyota Yaris Cross (+92.8%) repeats at #1 for its 2nd ever monthly win with a dominant 5% share. It however remains #2 year-to-date, far below the Toyota Corolla, down a ghastly -37.5% for the month. The new Volvo EX30 is up one spot on last month to climb back onto the podium at #3 and now ranks #4 year-to-date. #1 over the Full Year 2023 but down to #7 so far in 2024, the Tesla Model Y (-56.7%) freefalls at #4. The Opel Astra steps up a further four ranks on July to break into the Top 5 at #5, earning a spot inside the YTD Top 30 as a result at #28. This is the nameplate’s first Top 5 finish since December 2019 (#3). Outstanding performance also by the Toyota C-HR (+47.4%) at #8.
Previous month: Finland July 2024: Toyota Yaris Cross signs first ever win, C-HR up to #3
One year ago: Finland August 2023: Peugeot 2008 best-seller for the first time
Full August 2024 Top 30 brands and models below.
Note: These rankings feature the Top 30 brands and models year-to-date, ordered based on their August sales and may therefore not be 100% accurate.
Finland August 2024 – brands:
PosBrandAug-24%/23Jul2024%/23PosFY231Toyota1,03116.1%– 8.9%19,50719.1%– 8.0%112Volvo6149.6%+ 22.8%25,58611.2%+ 11.1%243Volkswagen5618.8%– 10.2%44,1418.3%– 30.0%434Kia5128.0%– 23.7%53,8527.7%– 15.6%555Skoda5088.0%– 24.2%34,4368.9%– 21.0%326Hyundai3275.1%+ 19.3%82,1954.4%+ 42.9%9117Mercedes3154.9%– 26.6%72,8175.7%– 28.1%678Tesla3124.9%– 45.5%182,1764.4%– 40.8%1069BMW2453.8%– 44.6%92,4915.0%– 27.3%7810Ford2413.8%– 1.6%101,4392.9%– 22.0%121211Nissan2333.6%+ 1.3%62,3244.7%+ 25.1%81012Audi2293.6%– 18.5%111,7183.5%– 33.9%11913Peugeot2163.4%– 70.0%137011.4%– 59.9%131314Opel1933.0%+ 227.1%125981.2%– 61.2%141415Mazda931.5%– 4.1%165681.1%– 17.3%161616Renault921.4%+ 130.0%174630.9%– 6.8%181917Subaru881.4%+ 780.0%213300.7%+ 89.7%232618Suzuki631.0%+ 37.0%145881.2%+ 19.8%152019Polestar590.9%– 39.2%153770.8%– 43.6%201720Dacia570.9%– 24.0%263630.7%– 34.2%211821BYD480.8%+ 182.3%193930.8%+ 962.2%19n/a22Citroen480.8%– 54.7%223530.7%– 62.8%221523Mitsubishi460.7%+ 7.0%204911.0%+ 22.8%172124Lexus420.7%– 27.6%242830.6%– 6.0%242425Cupra360.6%+ 24.1%232450.5%– 29.0%252226Porsche290.5%+ 480.0%271900.4%+ 38.7%282727Land Rover230.4%– 68.9%292030.4%– 38.1%262328Honda220.3%+ 15.8%281580.3%+ 4.6%292929Mini180.3%– 43.8%30950.2%– 24.0%302830Seat90.1%– 69.0%251920.4%– 23.2%2725
Finland August 2024 – models:
PosModelAug-24%/23Jul2024%/23PosFY231Toyota Yaris Cross3205.0%+ 92.8%12,2074.4%+ 61.2%282Toyota Corolla2423.8%– 37.5%22,9065.8%– 22.1%123Volvo EX302243.5%new41,6573.3%new42104Tesla Model Y1953.1%– 56.7%211,4212.9%– 50.6%715Opel Astra1732.7%n/a94350.9%+ 45.5%28546Peugeot 20081622.5%– 75.4%n/an/an/an/an/a137Toyota RAV41532.4%– 28.5%149161.8%– 21.0%1198Toyota C-HR1402.2%+ 47.4%31,0262.1%– 1.5%9149Toyota Yaris1302.0%– 29.0%51,9093.8%+ 11.0%3610Kia Ceed1272.0%– 26.2%111,0172.0%+ 0.6%101211VW ID.41201.9%+ 4.3%89091.8%– 38.3%131012Nissan Qashqai1171.8%+ 1.7%61,4492.9%+ 67.7%61513Tesla Model 31151.8%– 5.0%n/a7311.5%+ 10.6%161814VW Tiguan1141.8%+ 12.9%164430.9%– 25.3%262415Volvo XC601131.8%– 42.6%71,0692.2%– 38.4%8516Skoda Octavia1021.6%– 42.4%101,6183.3%+ 17.7%5317Ford Kuga991.5%+ 28.6%194620.9%– 21.3%233118Volvo V60951.5%+ 11.8%139131.8%+ 19.5%121919Skoda Enyaq861.3%– 44.9%127781.6%– 50.8%15420Kia Niro771.2%– 7.2%185401.1%– 4.3%212321VW ID.7711.1%newn/a4120.8%new30n/a22Mercedes GLC691.1%+ 23.2%156191.2%+ 44.0%183923Audi Q4631.0%– 40.0%176501.3%– 25.8%171624Kia Sportage631.0%– 17.1%n/a4370.9%– 18.3%273025Kia Stonic560.9%– 18.8%255191.0%– 23.1%2222n/aBMW X1440.7%– 51.1%245491.1%+ 22.8%2033n/aBMW i4420.7%– 66.7%n/a4450.9%– 54.7%2511n/aSkoda Fabia400.6%+ 29.0%n/a4550.9%+ 32.7%2449n/aHyundai Ioniq 5320.5%– 46.7%n/a4140.8%+ 22.5%2940n/aVW Golf230.4%– 63.5%225721.2%– 16.3%1925n/aVolvo XC40170.3%– 87.1%n/a9051.8%– 32.8%147
Source: AUT


